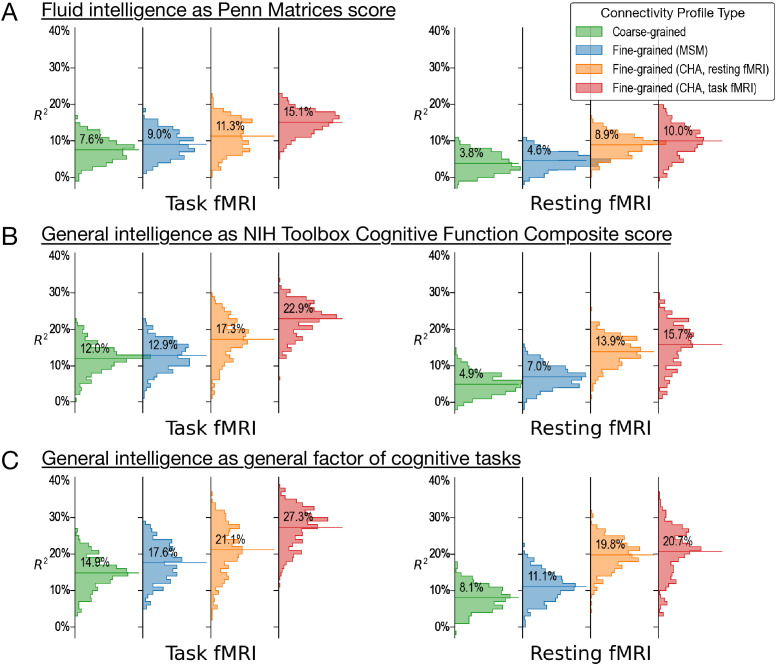
Appendix 1—figure 6. Predicting alternative measures of intelligence based on connectivity profiles.
Our prediction models and connectivity profiles can also be trained to predict other measures of intelligence, such as fluid intelligence measured with the Penn Matrices (A, variable ‘PMAT24_A_CR’ in the dataset) and general intelligence measured as the cognitive function composite score of the NIH Toolbox (B, ‘CogTotalComp_Unadj’). Similar to the results of the main paper (shown here as C for comparisons), predictions based on fine-grained hyperaligned connectivity profiles account for approximately two times more variance in intelligence compared with coarse-grained connectivity profiles for task functional magnetic resonance imaging (fMRI) data, and three times more for resting fMRI data. The four columns on the left side are based on connectivity profiles computed from task fMRI data, and the four on the right from resting fMRI data. For each kind of data, we computed fine-grained connectivity profiles based on three different alignment methods (multimodal surface matching, hyperalignment based on resting fMRI data, and hyperalignment based on task fMRI data), which we colored as blue, orange, and red, respectively. The orange and red colors denote the kind of data used to derive hyperalignment transformations. In the results shown in this figure, they may not be the same as data used to compute connectivity profiles.

