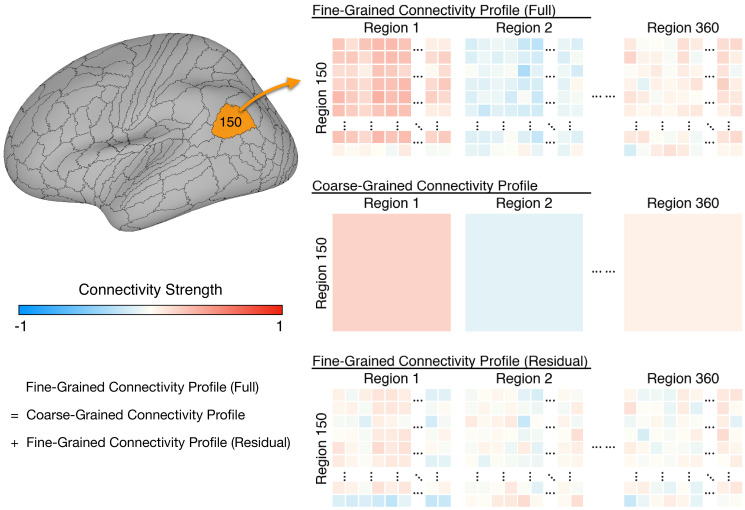
Figure 1. Schematic illustration of coarse- and fine-grained functional connectivity.
Each brain region (e.g., area 150 shown here) comprises multiple cortical vertices (on average 165). Correlations between their time series and time series for all 59,412 vertices in the whole cortex form that region’s full fine-grained connectivity matrix (top row). The fine-grained connectivity profiles for 360 brain regions each have approximately 10 million such correlations. The coarse-grained connectivity profile for the same region (middle row) comprises the average functional connectivity between all of the vertices in that region and all of the vertices in each of the 360 brain regions. Thus, the coarse-grained connectivity profiles for 360 brain regions each have 360 mean correlations. The residual fine-grained connectivity profile (bottom row) for each region is obtained by subtracting the mean correlation for a pair of regions (e.g., regions 1 and 150) from the full fine-grained connectivity profile for that pair and is, thus, unconfounded with coarse-grained functional connectivities. We refer to these unconfounded profiles as fine-grained connectivity profiles for short.

