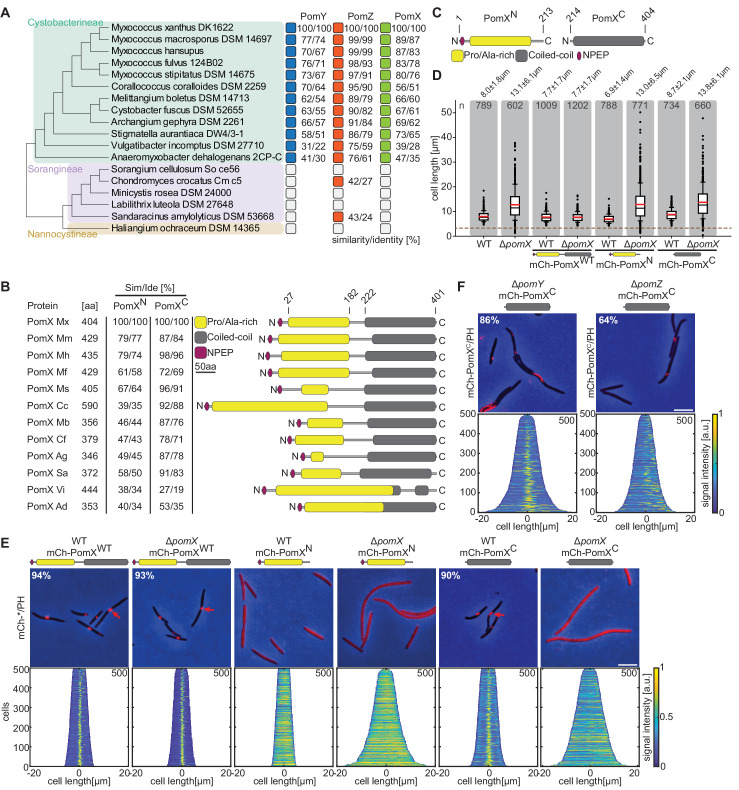
Figure 1. PomX consists of two domains that are both required for function.
(A) Similarity and identity analysis of PomX, PomY, and PomZ homologs. The three Myxococcales suborders are indicated. An open box indicates that a homolog is not present. (B) Similarity and identity of PomX domains in different PomX homologs. Similarity and identity were calculated based on the domains of M. xanthus PomX shown in C. (C) PomX truncations used in this study. Numbers on top indicate the start and stop positions of the truncations relative to full-length PomXWT. (D) Cell length distribution of cells of indicated genotypes. Cells below stippled line are minicells. Numbers indicate mean cell length±STDEV. In the boxplots, boxes include the 25th and the 75th percentile, whiskers data points between the 10% and 90% percentile, outliers are shown as black dots. Black and red lines indicate the median and mean, respectively. Number of analyzed cells is indicated. In the complementation strains, pomX alleles were expressed from plasmids integrated in a single copy at the attB site. (E) Fluorescence microscopy of cells of indicated genotypes. Phase-contrast and fluorescence images of representative cells were overlayed. Numbers indicate fraction of cells with fluorescent clusters. Demographs show fluorescence signals of analyzed cells sorted according to length and with off-center signals to the right. Numbers in upper right indicate number of cells used to create demographs. Scale bar, 5 µm. (F) Fluorescence microscopy of cells of indicated genotypes. Images of representative cells and demographs were created as in (E). Scale bar, 5 µm. For experiments in D, E and F similar results were obtained in two independent experiments.


