. 2021 Mar 18;10:e66160. doi: 10.7554/eLife.66160

Figure 2. PomXC interacts with PomX and PomY while PomXN stimulates PomZ ATPase activity.

(A) BACTH analysis of interactions between Pom proteins. The indicated protein fragments were fused to T18 and T25 as indicated. Blue colony indicates an interaction, white no interaction. Positive control in upper left corner, leucine zipper of GCN4 fused to T25 and T18. For negative controls, co-transformations with empty plasmids were performed. Images show representative results and were performed in three independent experiments. (B) TEM images of negatively stained purified proteins. Proteins were applied to the EM grids alone or after mixing in a 1:1 molar ratio as indicated before staining. Scale bar, 200 nm. Images show representative results of several independent experiments. (C, D) In vitro pull-down experiments with purified PomXC-Strep, PomXN-Strep, PomXWT-His6, and PomY-His6. Instant Blue-stained SDS-PAGE shows load (L), flow-through (FL), wash (W), and elution (E) fractions using MagStrep XT beads in pull-down experiments with 10 µM of indicated proteins alone or pre-mixed as indicated on top. Molecular size markers are shown on the left and proteins analyzed on the right together with their calculated MW. Note that PomXWT-His6 (Schumacher et al., 2017) and PomXN-Strep migrate aberrantly and according to a higher MW. All samples in a panel were analyzed on the same gel and black lines are included for clarity. Experiments were repeated in two independent experiments with similar results. (E–I) His6-PomZ ATPase activity. ADP production rate was determined in an NADH-coupled photometric microplate assay in the presence of 1 mM ATP at 32°C. DNA and PomX variants were added as indicated. Spontaneous ATP hydrolysis and NADH consumption was accounted for by subtracting the measurements in the absence of His6-PomZ. Data points show the mean±STDEV calculated from six independent measurements.

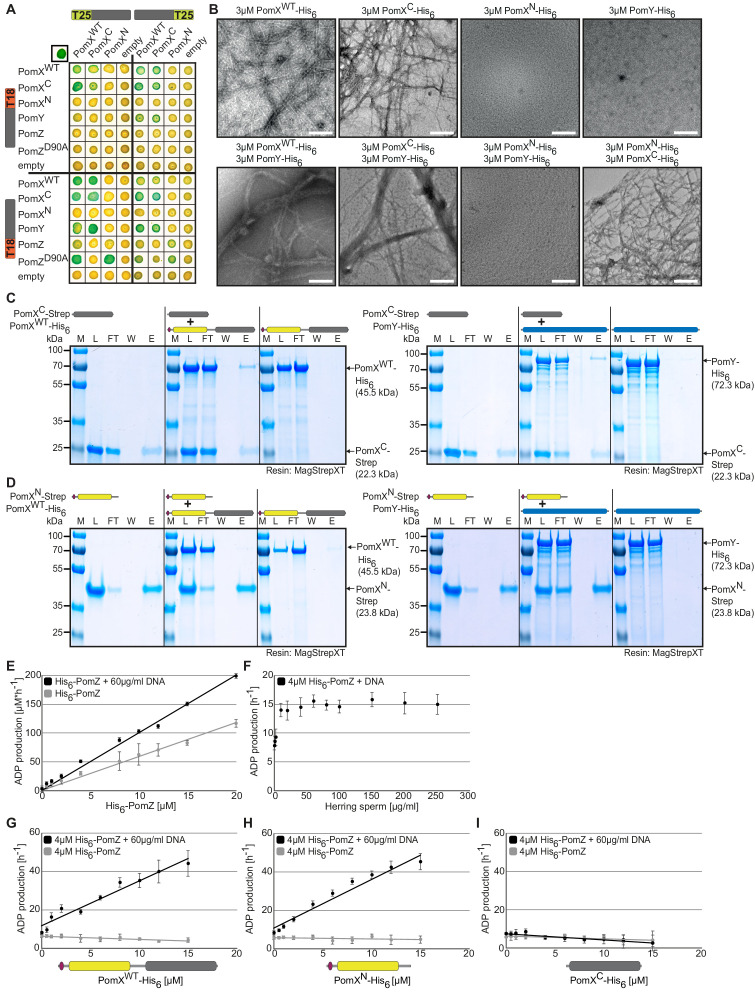
Figure 2—source data 1. Source data for Figure 2A.
Figure 2—source data 2. Source data for Figure 2B.
Figure 2—source data 3. Source data for Figure 2C.
Figure 2—source data 4. Source data for Figure 2D.
Figure 2—source data 5. Source data for Figure 2E.
Figure 2—source data 6. Source data for Figure 2F.
Figure 2—source data 7. Source data for Figure 2G.
Figure 2—source data 8. Source data for Figure 2H.
Figure 2—source data 9. Source data for Figure 2I.

Figure 2.

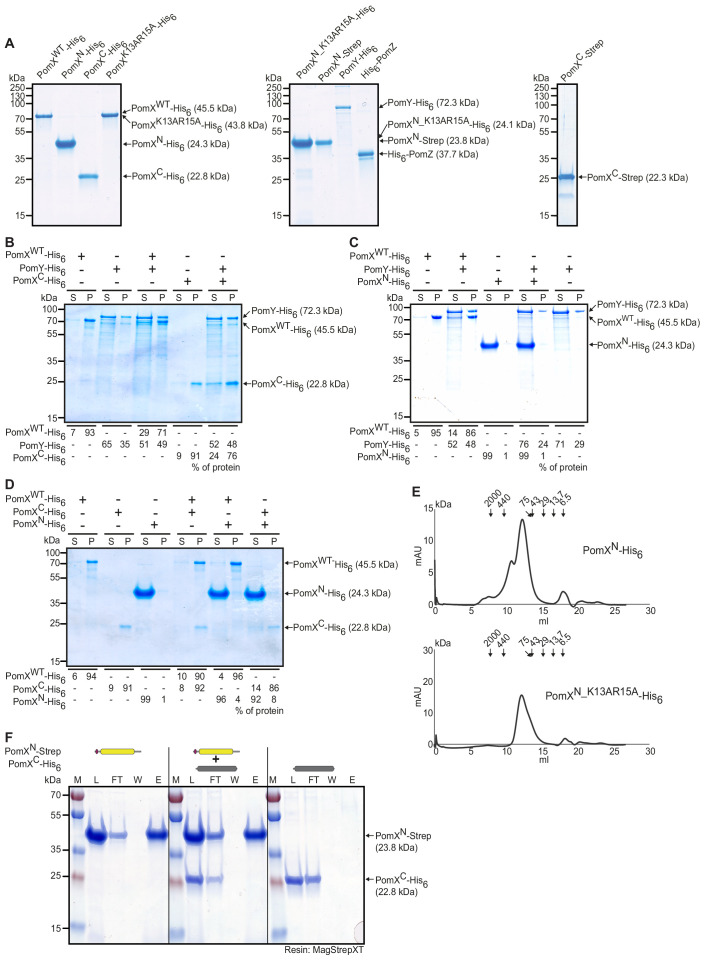
Figure 2—figure supplement 1. Purification and analysis of Pom proteins.

Figure 2—figure supplement 1.

(A) SDS-PAGE analysis of purified proteins used in this study. Molecular size markers are shown on the left and the purified proteins including calculated MW on the right. Two µg per protein was loaded. Note that PomXWT-His6, PomXN-His6, PomXK12AR15A-His6, PomXN_K13AR15A-His6, and PomXN-Strep do not separate according to their calculated MW. (B–D) Sedimentation assays with indicated proteins. The indicated proteins were mixed at final concentrations of 3 µM as indicated. Following high-speed ultracentrifugation, the supernatant (S) and pellet (P) fractions were separated by SDS-PAGE. Molecular size markers are shown on the left and analyzed proteins on the right. Numbers below show the quantification of indicated protein in the different fractions in %. Similar results were observed in two independent experiments. (E) Size exclusion chromatography elution profile of PomXN-His6 and PomXN_K13AR15A-His6. The elution pattern of PomXN-His6 and PomXN_K13AR15A-His6 from a Superdex 200 10/300 GL gel filtration column was measured at 280 nm. Arrows indicate elution maxima of protein standards of the indicated size in kDa. The same results were observed in two independent experiments. (F) In vitro pull-down experiments with purified PomXN-Strep and PomXC-His6. Instant Blue-stained SDS-PAGE shows load (L), flow-through (FL), wash (W), and elution (E) fractions using MagStrep XT beads in pull-down experiments with 10 µM of indicated proteins alone or pre-mixed as indicated on top. Molecular size markers are shown on the left and proteins analyzed on the right together with their calculated MW. All samples in a panel were analyzed on the same gel and black lines are included for clarity. Experiments were repeated in two independent experiments with similar results.
Figure 2—figure supplement 1—source data 1. Source data for Figure 2—figure supplement 1A.
Figure 2—figure supplement 1—source data 2. Source data for Figure 2—figure supplement 1B.
Figure 2—figure supplement 1—source data 3. Source data for Figure 2—figure supplement 1C.
Figure 2—figure supplement 1—source data 4. Source data for Figure 2—figure supplement 1D.
Figure 2—figure supplement 1—source data 5. Source data for Figure 2—figure supplement 1E.
Figure 2—figure supplement 1—source data 6. Source data for Figure 2—figure supplement 1F.