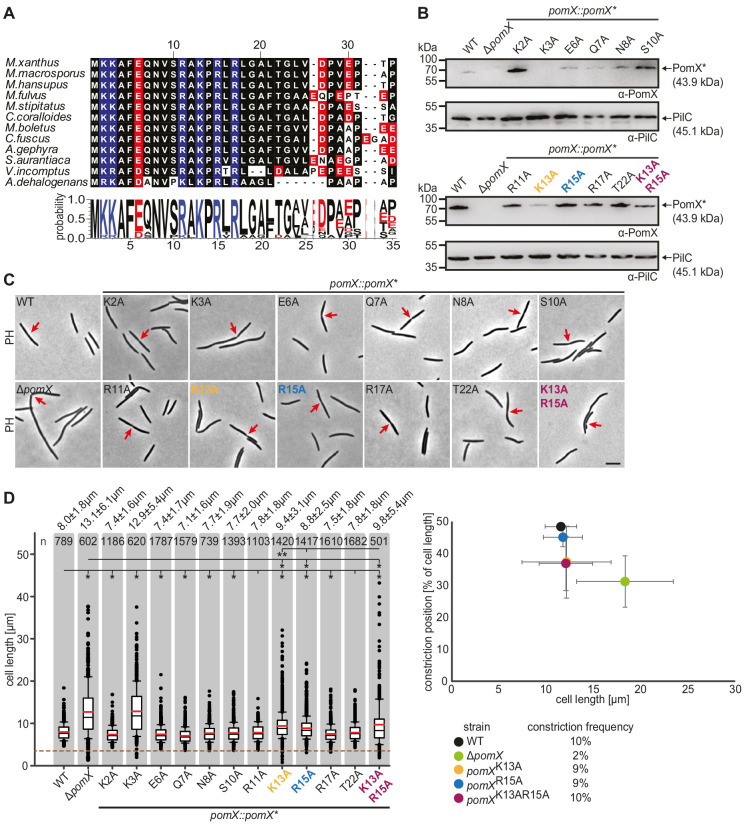
Figure 3. PomXN harbors a conserved N-terminal peptide crucial for cell division site positioning at midcell.
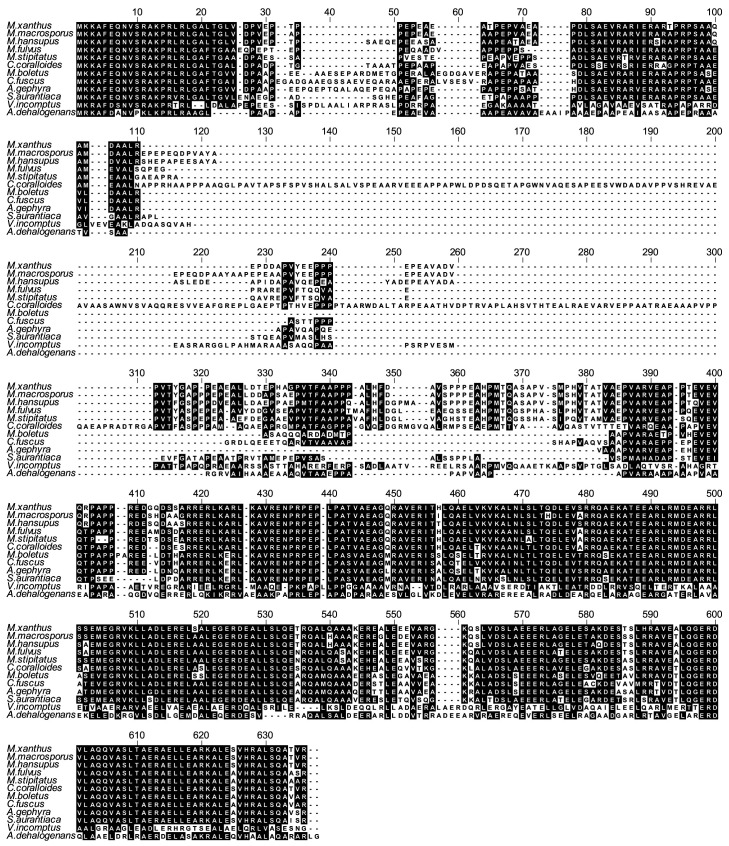
(A) Multiple sequence alignment of the conserved PomX N-terminus. Black background indicates similar amino acids. Positively and negatively charged residues are indicated in blue and red, respectively. Weblogo consensus sequence is shown below. (B) Western blot analysis of accumulation of PomX variants. Protein from the same number of cells was loaded per lane. Molecular mass markers are indicated on the left. PilC was used as a loading control. (C) Phase-contrast microscopy of strains of indicated genotypes. Representative cells are shown. Red arrows indicate cell division constrictions. Scale bar, 5 µm. (D) Analysis of cell length distribution and cell division constrictions of cells of indicated genotypes. Left panel, boxplot is as in Figure 1D. Number of cells analyzed is indicated at the top. *p<0.001; **p<0.05 in Mann-Whitney test. Right panel, cell division position in % of cell length is plotted as a function of cell length. Dots represent mean ± STDEV. Numbers below indicate cell division constriction frequency. In B, C, and D, similar results were obtained in two independent experiments.


