. 2021 Mar 18;10:e66160. doi: 10.7554/eLife.66160

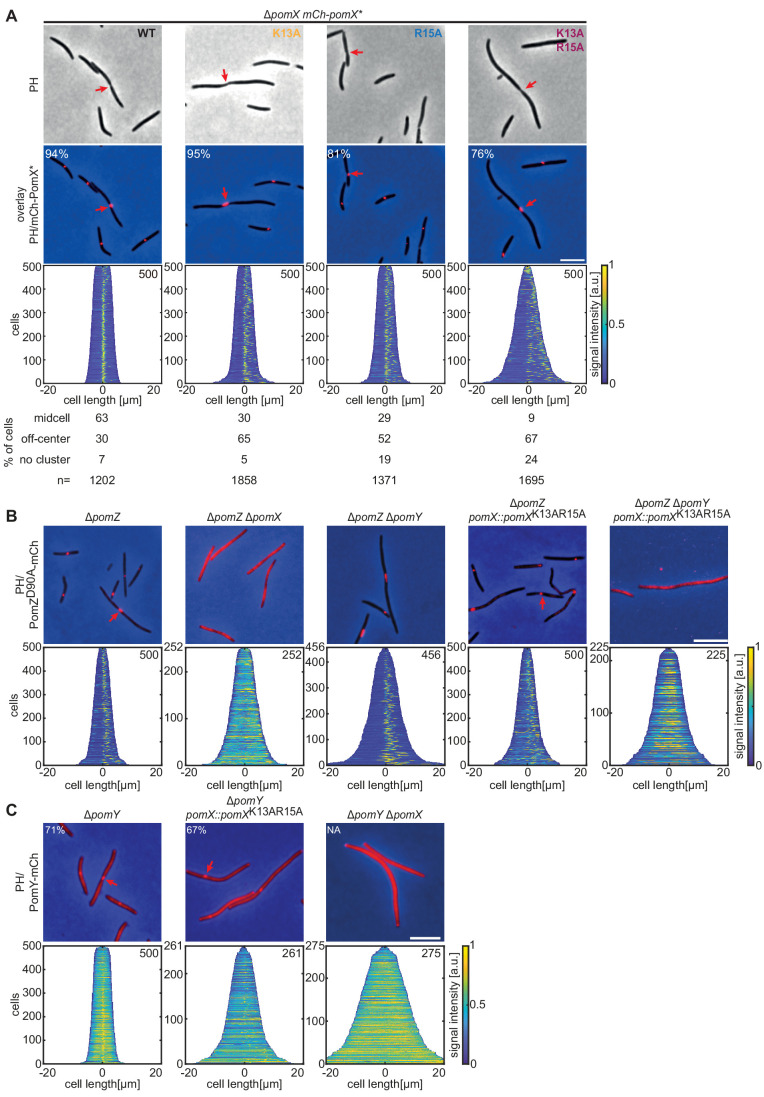
Figure 4. PomXK13AR15A forms clusters and interacts with PomY but not with PomZ in vivo.

(A-C) Fluorescence microscopy of cells of indicated genotypes. Phase-contrast (PH) images and/or overlays of fluorescence images and PH of representative cells. Red arrows indicate division constrictions. Scale bar, 5 µm. In A, numbers in overlays indicate fraction of cells with a cluster and numbers below indicate localization patterns in % and number of cells analyzed. Demographs are as in Figure 1E. Similar results were observed in two independent experiments.

Figure 4—source data 1. Source data for Figure 4A.
Figure 4—source data 2. Source data for Figure 4B.
elife-66160-fig4-data2.xlsx (228.8KB, xlsx)
Figure 4—source data 3. Source data for Figure 4C.
elife-66160-fig4-data3.xlsx (187.9KB, xlsx)

Figure 4.

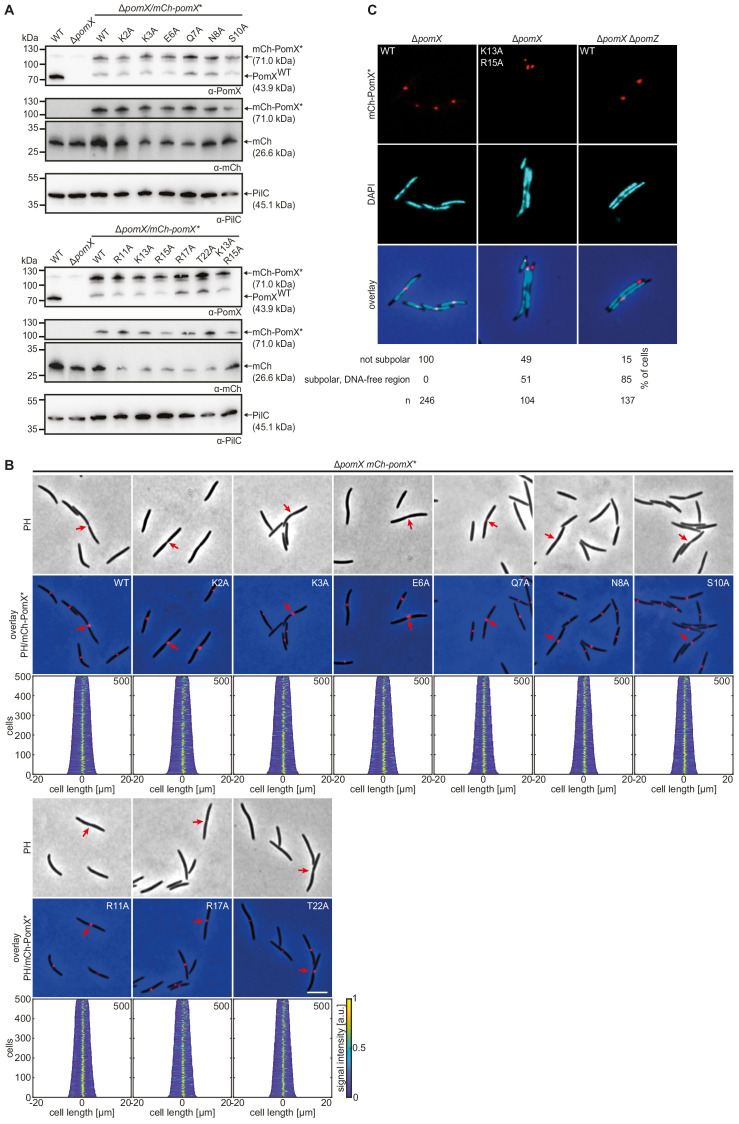
Figure 4—figure supplement 1. The PomXK13AR15A variant is impaired in function.

Figure 4—figure supplement 1.

(A) Western blot analysis of the accumulation of mCh-PomX variants in indicated strains. Protein from the same number of cells was loaded per lane. Molecular mass marker is shown on the left and analyzed proteins on the right. The same blots were sequentially analyzed with α-PomX (top panel), α-mCh (middle panel), and α-PilC (lower panel) antibodies. PilC was used as a loading control. Note PomX (43.9 kDa) does not migrate at the expected size in SDS-PAGE but instead as a protein of a molecular weight of 72 kDa. Similarly, mCh-PomX migrates at ~110 kDa. Similar results were obtained in two independent experiments. (B) Fluorescence microscopy of indicated mCh-PomX variants. Phase-contrast and fluorescence images of representative cells and the overlay are shown. Red arrows indicate cell division constrictions. Scale bar, 5 µm. Demographs were created as in Figure 1E. Experiments were repeated in two independent experiments with similar results. (C) Fluorescence microscopy of mCh-PomX variants in DAPI-stained cells of the indicated genotype. The mCh signal (first panel), DAPI signal (second panel), and the overlay (third panel) show representative cells. Amino acid substitutions are indicated in white in the mCh images. Scale bar, 5 µm. Quantification of mCh-PomX* localization patterns in % and the number of analyzed cells is shown below the images. Images show representative cells. Similar results were obtained in two independent experiments.
Figure 4—figure supplement 1—source data 1. Source data for Figure 4—figure supplement 1A.
Figure 4—figure supplement 1—source data 2. Source data for Figure 4—figure supplement 1C.
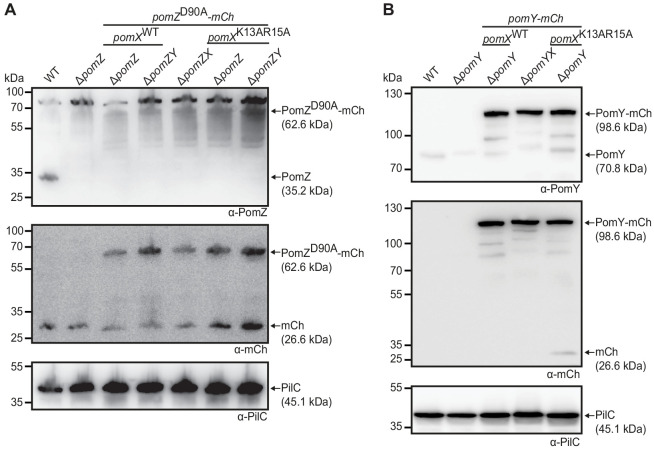
Figure 4—figure supplement 2. Western blot analysis of PomY-mCh and PomZD90A-mCh accumulation.

Figure 4—figure supplement 2.

(A) Western blot analysis of PomZD90A-mCh accumulation in indicated strains. Protein from the same number of cells was loaded per lane. Molecular mass markers are indicated on the left and analyzed proteins including MW on the right. The same blots were sequentially analyzed with α-PomZ (top panel), α-mCh (middle panel), and α-PilC (lower panel). PilC was used as a loading control. The same results were observed in two independent experiments. (B) Western blot analysis of PomY-mCh accumulation in indicated strains. Blots were done as in (A), but α-PomY antibodies were used instead of α-PomZ antibodies. The same results were observed in two independent experiments.
Figure 4—figure supplement 2—source data 1. Source data for Figure 4—figure supplement 2A.
Figure 4—figure supplement 2—source data 2. Source data for Figure 4—figure supplement 2B.