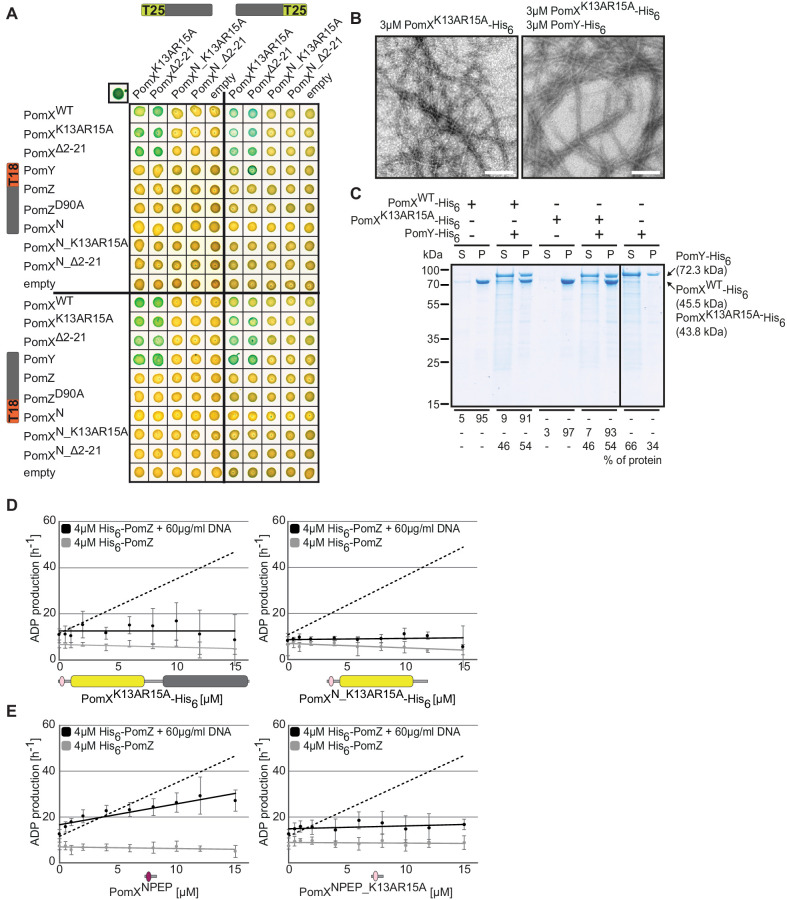
Figure 5. PomX AAP activity resides in PomXNPEP.
(A) BACTH analysis of interactions between Pom proteins and PomX variants. Experiments were performed in parallel with those in Figure 2A. For presentation purposes, the results for PomXWT and PomXN T25 fusion proteins and their interaction with PomZ and PomZD90A T18 fusion proteins were not included but are included in Figure 2A. Images show representative results and similar results were obtained in three independent experiments. (B) TEM images of negatively stained purified proteins. Experiments were done as in Figure 2B. Scale bar, 200 nm. Images show representative results of several independent experiments. (C) Sedimentation assays with indicated purified proteins. Proteins were analyzed at a concentration of 3 µM alone or in combination. After high-speed centrifugation, proteins in the supernatant (S) and pellet (P) fractions were separated by SDS-PAGE and stained with Instant Blue. Molecular size markers are shown on the left and analyzed proteins on the right including their calculated MW. Numbers below indicate % of proteins in different fractions. Similar results were obtained in two independent experiments. All samples were analyzed on the same gel; the black line indicates that lanes were removed for presentation purposes. (D, E) His6-PomZ ATPase activity. Experiments were done and analyzed as in Figure 2E–I in the presence or absence of DNA and the indicated proteins and peptides. Data points show the mean±STDEV calculated from six independent measurements. In (D), stippled lines indicate the regression of the ADP production rate in the presence of PomXWT-His6 (left, Figure 2G) and PomXN-His6 (right, Figure 2H). In E, the stippled line indicates the regression of the ADP production rate in the presence of PomXWT-His6.

