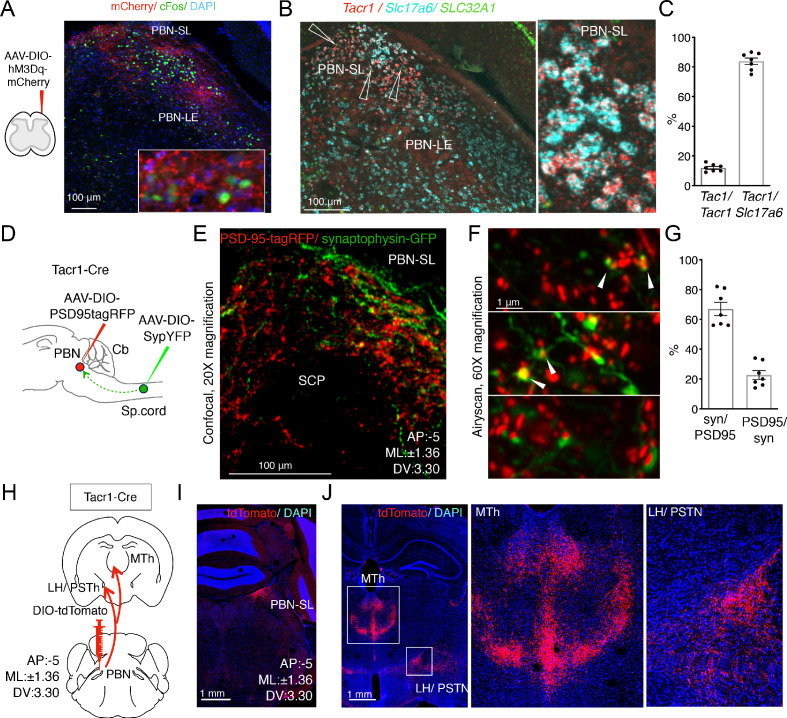
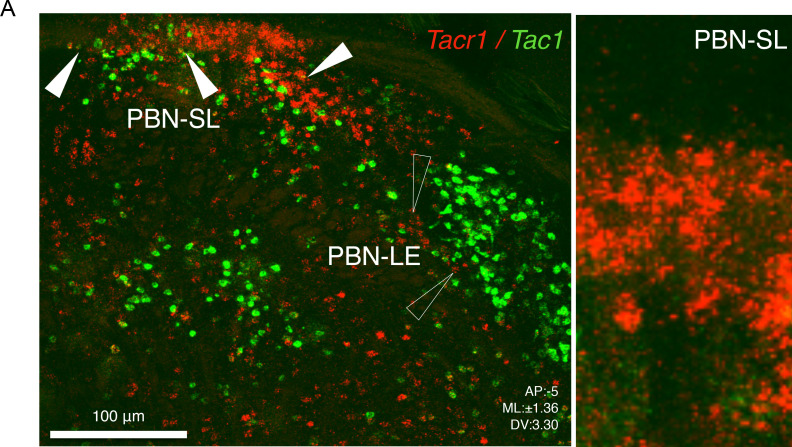
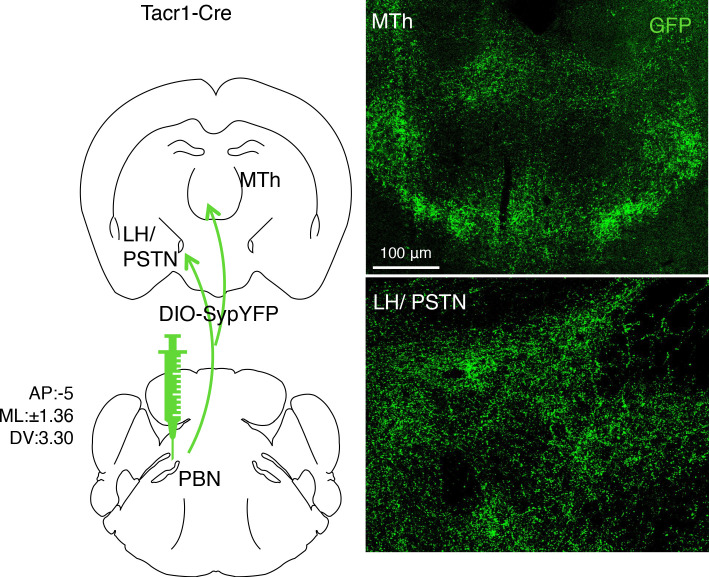
Figure 2. Anatomical organization of a Tacr1-defined spinoparabrachial circuit.
(A) SpinalTacr1 neurons were transduced to express hM3Dq-mCherry (cartoon, left); typical confocal image of a coronal section of the PBN showing mCherry-positive SpinalTacr1 projections (right panel, red) in two regions of the PBN (PBN-EL and PBN-SL). Application of CNO resulted in Fos induction throughout the PBN (green). The nuclear stain DAPI (blue) highlights the overall anatomy of the region. Scale = 100 μm. (B) Multichannel in situ hybridization shows Tacr1 transcript (red) is localized to the PBN-SL. Co-staining for the glutamate vesicular transporter Slc17a6 (Vglut2; cyan) and GABA vesicular transporter SLC32A1 (Vgat; green) reveals most Tacr1-positive PBN-SL neurons are glutamatergic and hence excitatory. (C) Quantification of the percentage of Tacr1-positive cells co-expressing Tac1 (left plot) and Vglut2 (right plot). (D) A cartoon depicting the strategy used to label spinalTacr1 presynaptic specializations and PBN-SLTacr1 postsynaptic specializations in the same animal. Cre-dependent viral vectors were injected in the lumbar spinal cord (AAV-DIO-SypYFP to label presynaptic termini) and PBN (AAV-PSD95tagRFP to label postsynaptic densities) in Tacr1Cre mice. (E) Example confocal image of a coronal section from the PBN showing a low-magnification view of the organization of SpinalTacr1 presynaptic specializations (green) and PBN-SLTacr1 postsynaptic specializations (red). Scale = 100 μm.(F) Super-resolution imaging (Airyscan) of sections from three different mice showing close apposition of SypYFP and PSD95tagRFP puncta indicative of synaptic connections. Scale = 1 μm. (G) Quantification of number of SypYFP puncta with PSD95tagRFP puncta in close apposition (left graph) and vice versa (right graph) demonstrate that the majority of spinal projection neurons target PBN-SLTacr1 neurons; n = 7 sections from n = 3 mice. (H) A cartoon depicting the viral strategy for anterograde tracing of PBN-SLTacr1 neuron projections using injection of AAV-DIO-tdTomato into the PBN of Tacr1Cre mice. (I) Confocal image of coronal section showing tdTomato labeling (red) of cell bodies of PBN-SLTacr1 neurons. (J) Dense projections were found in two major brain regions, (left image; boxed regions): the medial thalamus (MTh) and a region encompassing part of the lateral hypothalamus (LH) and the parasubthalamic nucleus (PSTN). Right images show larger magnification views of boxed regions. Scale = 1 mm.


