
Author response image 1. Comparison of our ORC/MCM ChIPs with previous Orc1 and Orc2 ChIP-seq data.
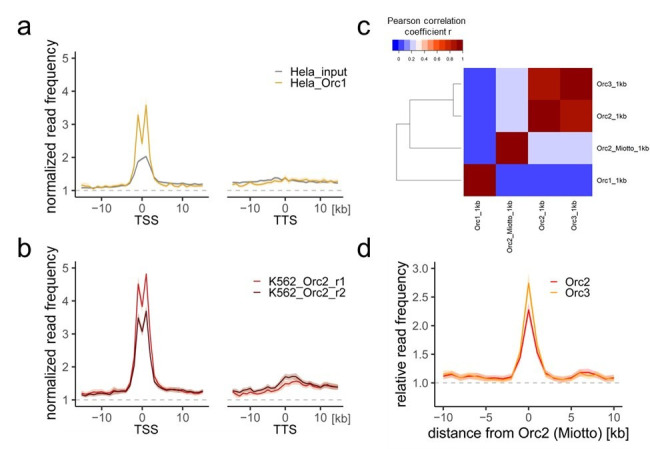
a) HeLa Orc1 and b) K562 Orc2 normalized read frequencies around TSSs or TTSs (independent of gene activity). Only genes larger than 30 kb without any adjacent gene within 15 kb were considered. Distances from TSSs or TTSs are indicated in kb. Means of Orc1 and Orc2 frequencies are shown ± 2 x SEM (lighter shadows). The dashed grey horizontal line indicates relative read frequency 1.0 for reference. c) Heat map of Pearson correlation coefficients R of our ORC ChIPs and the sum of two Orc2 replicates in K562 (Miotto et al.) and Orc1 in HeLa (Dellino et al., 2013) at 1 kb resolution. Column and line order were determined by complete linkage hierarchical clustering using the correlation distance (d = 1-r). d) Average ORC relative read frequencies at Orc2 (Miotto et al., 2016) peaks (>1 kb).