
Figure 5. Relative TE changes evoked by depleting 40S subunits are broadly comparable to those evoked by the tma∆∆ mutations or by increased eIF2α phosphorylation.
(A) Polysome profiles of WT strain H2994 and the rps26∆∆ mutant JVY09. Cells cultured in SC medium with 2% galactose and 2% raffinose instead of glucose at 30°C to log-phase were shifted to glucose-containing SC medium for 3 hr and treated with 50 μg/mL of CHX for 5 min before harvesting at 4°C. WCEs were resolved by sedimentation through sucrose gradients and scanned at 260 nm to visualize (from left to right) free 40S and 60S subunits, 80S monosomes, and polysomes. The mean polysome/monosome (P/M) ratios ± SEMs from five biological replicates are shown. (B) Volcano plot showing the log2 ratios of relative TEs in the rps26∆∆ mutant versus WT cells (∆TErps26∆∆ values) for each mRNA (x-axis) versus negative log10 of the FDR for the ∆TErps26∆∆ changes determined by DESeq2 analysis of ribosome profiling data for the 5187 mRNAs with evidence of translation (y-axis). The dotted line marks the 5% FDR threshold. mRNAs showing a significant increase (∆TErps26∆∆_up) or decrease (∆TErps26∆∆_down) in relative TE in the rps26∆∆ mutant versus WT cells at FDR < 0.05, are plotted in dark or light blue circles, respectively. (C) Cumulative distribution function (CDF) plots of log2WT TE values for all mRNAs (black) and mRNAs exhibiting a significant increase (∆TErps26∆∆_up, solid dark blue) or decrease (∆TErps26∆∆_down, dotted light blue) in relative TE (at FDR < 0.05) in the rps26∆∆ mutant versus WT cells. p values were calculated using the Kolmogorov-Smirnov test. (D) Hierarchical clustering analysis of log2TE changes observed for 248 mRNAs that exhibit significant TE changes in the tma∆∆ mutant versus WT cells, in SM-treated versus untreated WT cells, and also in the rps26∆∆ mutant versus WT cells, at p < 0.05 for all genotypes/conditions. The color scale for log2ΔTE values ranges from 3.5 (dark blue) to −2.5 (dark red). (E–F) Notched box plots showing translation changes (log2ΔTE) in the indicated mutant versus WT for mRNAs exhibiting a significant increase (∆TEtma∆∆_up, N = 385, panel E) or decrease (∆TEtma∆∆_down, N = 175, panel F) in relative TE in the tma∆∆ mutant versus WT cells at a 5% FDR threshold. A few outliers were omitted from the plots to expand the y-axis scale. p values were calculated using the Mann-Whitney U test for the differences between the indicated groups of mRNAs versus all mRNAs. (Columns 1–2 in panels (E–F) were previously compared in Figure 4—figure supplement 2A–B).

Figure 5—figure supplement 1. Reproducibility between biological replicates of ribosome footprint profiling and RNA-seq analyses for WT and the rps26∆∆ mutant.

Figure 5—figure supplement 2. The rps26∆∆ mutations do not derepress GCN4 mRNA translation or confer 40S recycling defects.

Figure 5—figure supplement 3. 40S subunit depletion in the rps26∆∆ mutant increases the relative TEs of mRNAs with attributes similar to mRNAs showing TE increases conferred by the tma∆∆ mutations.

Figure 5—figure supplement 4. Effects of the rps26∆∆ mutations on the relative TEs of the "+Rps26" and "ΔRps26" groups of mRNAs.
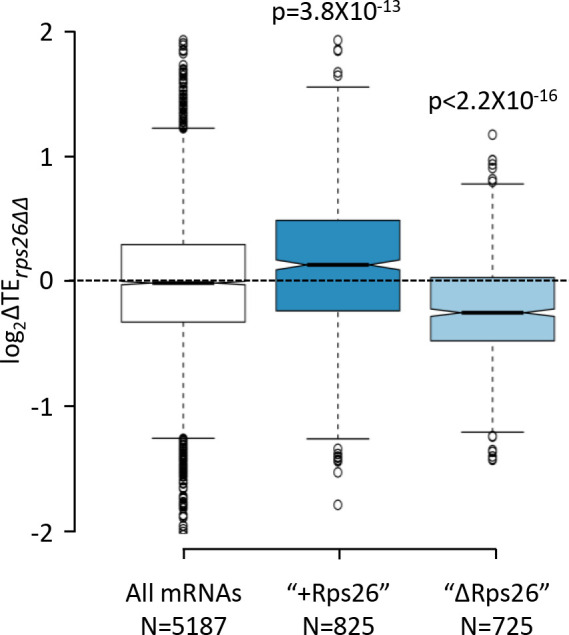
Figure 5—figure supplement 5. Effects of rps29b∆ and rps0b∆ mutations on relative TEs of different groups of mRNAs calculated from the ribosome footprint profiling and RNA-seq data of Cheng et al., 2019.
