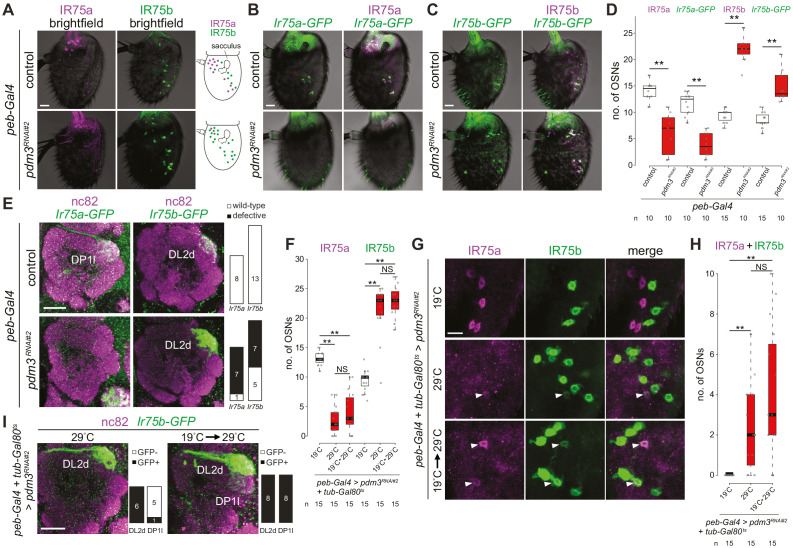
Figure 6. Pdm3 is required to distinguish Ir75a and Ir75b neuron fate.
(A) Immunofluorescence for IR75a and IR75b on whole-mount antennae of control (peb-Gal4,UAS-Dcr-2/+) and pdm3RNAi#2 (peb-Gal4,UAS-Dcr-2/+;UAS-pdm3HMJ21205/+) animals. Scale bar = 10 µm. The schematics on the right summarize the distribution of labeled neurons. (B) Immunofluorescence for GFP and IR75a on whole-mount antennae of control (peb-Gal4,UAS-Dcr-2/+;Ir75a-GFP/+) and pdm3RNAi#2 (peb-Gal4,UAS-Dcr-2/+;Ir75a-GFP/UAS-pdm3HMJ21205) animals. Scale bar = 10 µm. (C) Immunofluorescence for GFP and IR75b on whole-mount antennae of control (peb-Gal4,UAS-Dcr-2/+;Ir75b-GFP/+) and pdm3RNAi#2 (peb-Gal4,UAS-Dcr-2/+;Ir75b-GFP/UAS-pdm3HMJ21205) animals. Scale bar = 10 µm. (D) Quantification of the number of neurons that express Ir75a-GFP or Ir75b-GFP in the genotypes shown in (B–C). Comparisons to the controls are shown (pairwise Wilcoxon rank-sum two-tailed test and p-values adjusted for multiple comparisons with the Bonferroni method, **p<0.001). The increase in number of Ir75b-GFP labeled neurons in pdm3RNAi is lower than the increase in IR75b-expressing neurons, potentially because the transgenic reporter is not fully faithful in this genetic background. (E) Immunofluorescence for nc82 and GFP on whole-mount antennal lobes of control and pdm3RNAi#2 animals. Genotypes are as in (B–C). Scale bar = 20 µm. Quantification of phenotypes are shown on the right. (F) Quantification of the number of Ir75a and Ir75b neurons in animals (peb-Gal4,UAS-Dcr-2/+;pdm3RNAi#2/+;UAS-Gal80ts/+) in which peb-Gal4-driven pdm3RNAi is continuously suppressed (19°C, the permissive temperature for the Gal4 inhibitor Gal80ts), continuously allowed (29°C, the restrictive temperature for Gal80ts) or induced only in adults (19°C → 29°C temperature shift after eclosion). Comparisons between conditions are shown for each neuron type (pairwise Wilcoxon rank-sum two-tailed test with Bonferroni correction for multiple comparisons, **p<0.001, NS p>0.05). (G) Immunofluorescence for IR75a and IR75b on whole-mount antennae of the genotypes shown in (F). Single optical sections are shown, to reveal the weak co-expression of IR75a and IR75b in a subset of cells (arrowheads). Scale bar = 10 µm. (H) Quantification of the number of neurons that co-express IR75a and IR75b. Comparisons to the controls are shown (pairwise Wilcoxon rank-sum two-tailed test with Bonferroni correction for multiple comparisons, **p<0.001, NS p>0.05). (I) Immunofluorescence for nc82 and GFP on whole-mount antennal lobes of pdm3RNAi#2 animals (peb-Gal4,UAS-Dcr-2/+;UAS-pdm3HMJ21205/Ir75b-GFP;UAS-Gal80ts/+) in which RNAi is allowed throughout development (29°C) or limited only to adults (19°C → 29°C temperature shift after eclosion). Quantification of glomerular labeling pattern by the Ir75b-GFP reporter is shown on the right of each image.


