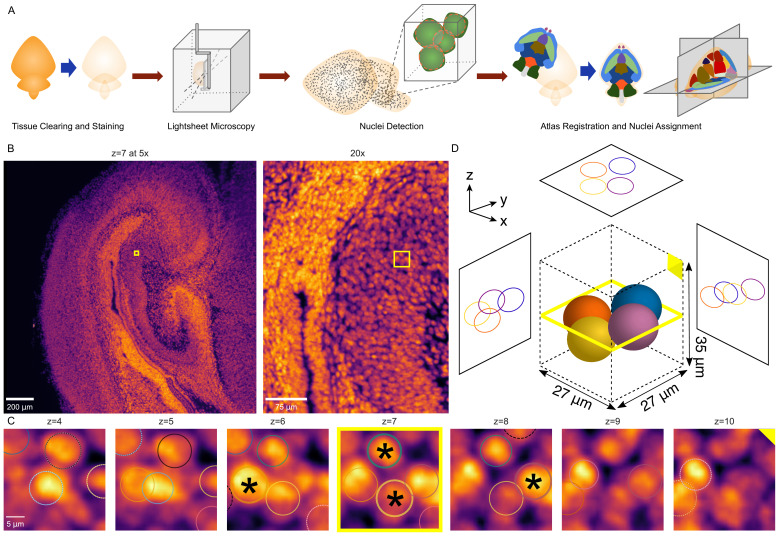
Figure 6. 3D whole-brain nuclei detection pipeline.
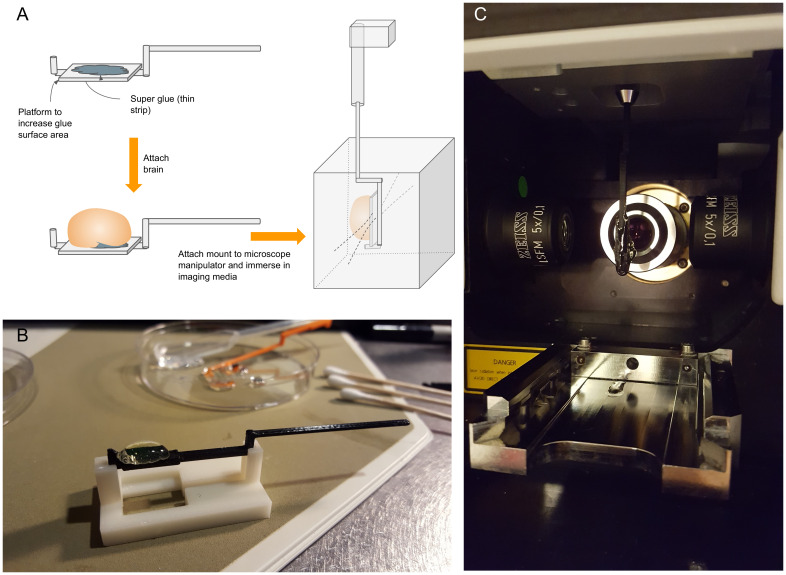
(A) Overview of the nuclei detection and assignment pipeline. After tissue clearing by CUBIC and nuclear staining, we imaged intact whole P0 mouse brains by lightsheet microscopy (Figure 6—figure supplement 1). The E18.5 mouse brain atlas was registered to volumetric sample images. Nuclei were identified brain-wide with a 3D blob detector algorithm, and the nuclei coordinates were used to map to specific region labels, allowing quantification of nuclei counts and density for each label. (B) Axial view of the hippocampus of a P0 mouse brain at the original magnification of 5x (left) and zoomed to 20x (right), with the same region of interest (ROI) depicted by the yellow box in both. (C) Serial 2D planes along the ROI shown by the yellow box in part ‘B’ show the emergence and disappearance of nuclei while progressing vertically (z-axis) through the ROI. Each of four individual nuclei is assigned a unique colored circle. The most central image of the nuclei is indicated by a solid circle and asterisk, while images above or below have dashed circles. (D) 3D schematic of the four nuclei from part ‘C’ demonstrating their spatial orientation.


