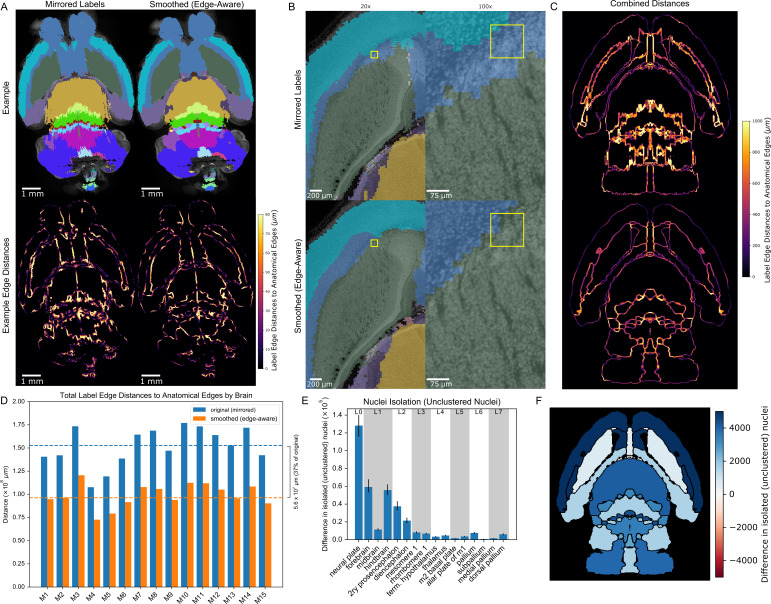
Figure 7. 3D reconstructed atlas validation in wild-type mouse brains at cellular resolution.
(A) Example of the original (mirrored, left) and smoothed (edge-aware, right) E18.5 atlases registered to a representative cleared, optically-sectioned P0 wild-type mouse brain. Edge distances between the registered labels and the brain’s own anatomical edge map are reduced for this example brain, shown by the color gradient for each edge (bottom). (B) Label alignment at higher resolution. The top row depicts the registered original (mirrored) atlas at 20x and 100x around a region of interest highlighted by a yellow box. This same brain region is depicted in the bottom row, but overlaid with the refined atlas registered using identical transformations as in the original atlas. (C) Summation of the edge distances across all 15 wild-type brains with color gradient showing the edge distances with the original (top) and smoothed (bottom) labels. (D) Total edge distance at the whole-brain level before and after atlas refinement for each of these brains. (E) Density-based nuclei clustering within each label. Many of the isolated nuclei that could not be clustered in the original labels were clustered in the refined labels, with differences in unclustered nuclei shown from 16 regions selected across the hierarchy of labels from the grossest (neural plate, L0, left) to the finest (e.g. dorsal pallidum, L7, right). Error bars represent 95% confidence intervals. (F) The differences between the original and refined labels’ unclustered nuclei are depicted on an anatomical map showing this metric as a color gradient across all the sublevel labels present in a cross section. Improvements with the refined atlas are colored in blue, while red represents better performance with the original atlas. A complete list of differences for each metric in each label is provided in Supplementary file 2.

