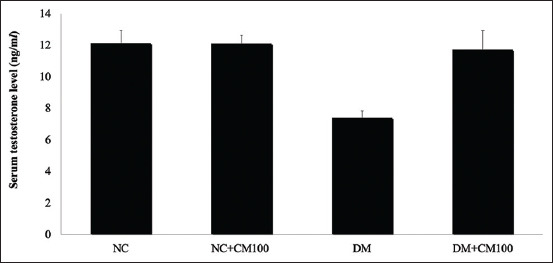
Figure-2.

Serum testosterone level. All data are shown as mean±SD. The different characters indicated significant differences (p<0.05). NC=Normal control rats; NC+CM100, normal rats treated with Cordyceps militaris (CM) (100 mg/kg); DM=Diabetic control rats; DM+CM100, diabetic rats treated with CM (100 mg/kg). a,bDifferent letters as superscript indicate the difference between the different groups of experiment.
