Figure 1.

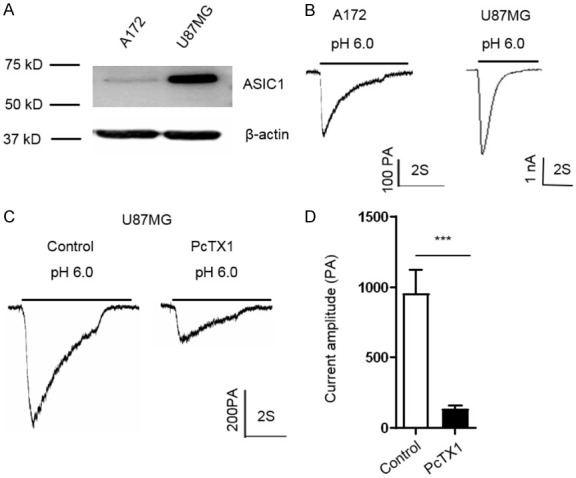
Expression of ASIC1 and electrophysiological characteristics of ASICs currents in glioma A172 and U87MG cells. (A) Representative Western blot bands showing ASIC1 proteins in A172 and U87MG cells. (B) Representative traces showing the ASIC current in A172 and U87MG cells. (C) Representative traces and (D) statistical results showing the inhibitory effect of PcTX1 (20 nM) on ASIC current in U87MG cells. Data are expressed as mean ± SEM. n=5. ***P < 0.001 by Students’ t-test.
