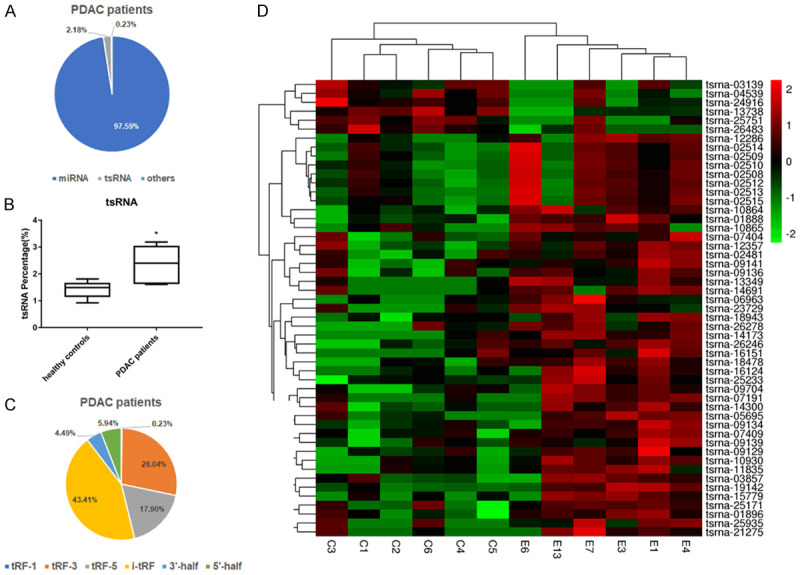
Figure 1.

Differential expression analysis of serum tsRNAs in PDAC patients, compared with healthy controls. A. The types of small RNAs in serum from PDAC patients. B. The proportion of tsRNAs in small RNA have statistical significance between PDAC and health controls. C. The types of tsRNAs in serum from PDAC patients. D. Heatmap depicting the expression of the 51 differentially expressed tsRNAs across all 12 samples of PDAC and healthy controls. C1, C2, C3, C4, C5, C6 refer to samples from healthy normal people (n = 6); E1, E3, E4, E6, E7, E13 refer to samples from PDAC patients (n = 6).
