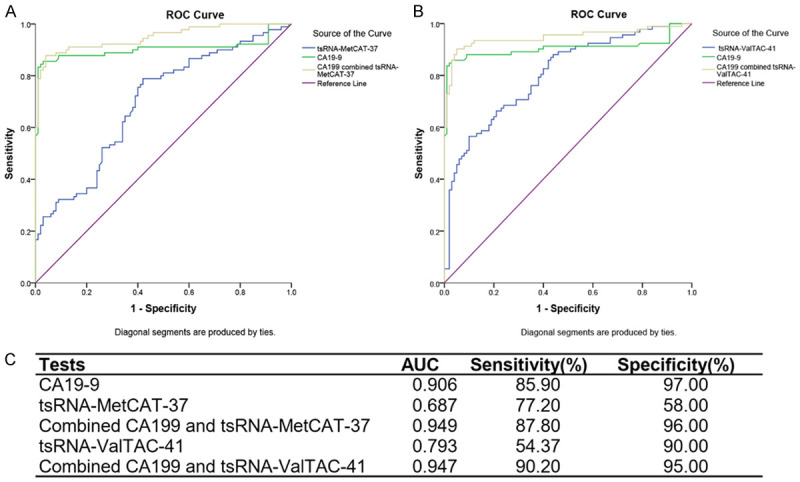
Figure 3.

ROC analyses of PDAC prediction based on serum tsRNAs and CA19-9. (A, B) ROC curve analysis of ΔCt summation of serum CA19-9 combined with tsRNA-MetCAT-37 (A) and tsRNA-ValTAC-41 (B) of 110 PDAC patients and 100 healthy controls. (C) AUC, sensitivity and specificity of serum CA19-9, tsRNA-MetCAT-37 and tsRNA-ValTAC-41.
