
Figure 1.
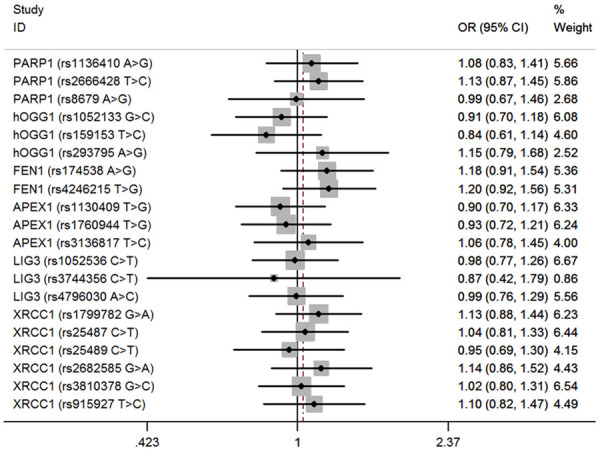
Forest plot for the association between BER gene SNPs and hepatoblastoma susceptibility under the recessive model (MM vs. WW/WM). For each SNP, the estimates of OR and its 95% CI are plotted with a box and a horizontal line.
Official websites use .gov
A
.gov website belongs to an official
government organization in the United States.
Secure .gov websites use HTTPS
A lock (
) or https:// means you've safely
connected to the .gov website. Share sensitive
information only on official, secure websites.
Forest plot for the association between BER gene SNPs and hepatoblastoma susceptibility under the recessive model (MM vs. WW/WM). For each SNP, the estimates of OR and its 95% CI are plotted with a box and a horizontal line.