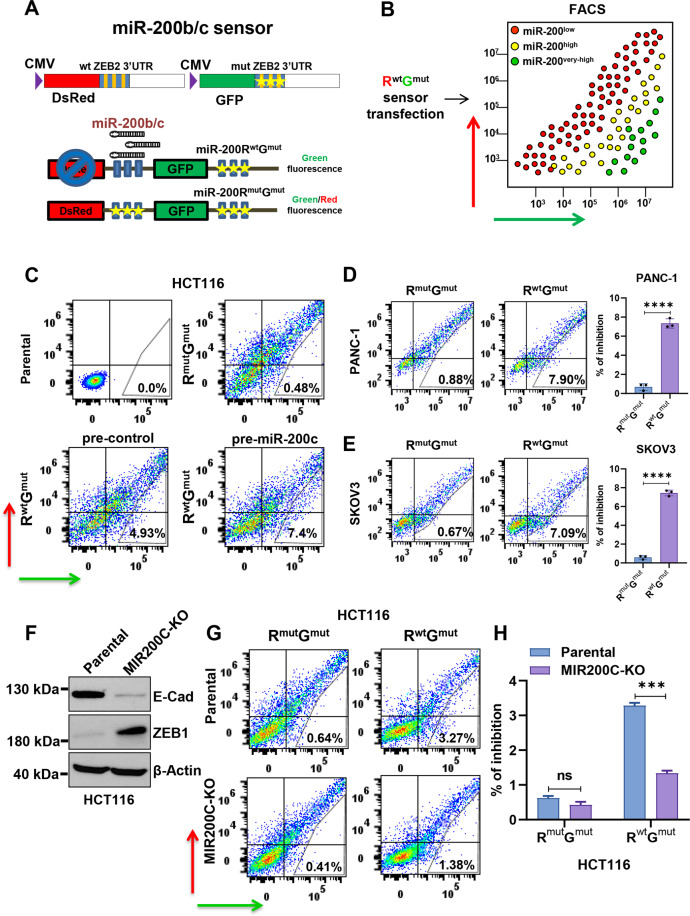
Fig. 1. The miRNA sensor plasmid can be transiently transfected in cells to detect miR-200b/c levels and distinguish differential EMT states.
A Schematic representation of the miR-200b/c sensor. GFP Green Fluorescent Protein, DsRed Discosoma Red Fluorescent Protein, RmutGmut and RwtGmut. wt wild-type, mut mutated, ZEB2 3′UTR 3′ untranslated region of ZEB2 gene. B Schematic representation of the separation of miR-200b/c sensor-transfected cells in a FACS plot. The X axis represents green fluorescence intensity, and the Y axis represents red fluorescence intensity. Red dots indicate miR-200b/c low cells, yellow dots are miR-200b/c high cells, and in green are cells with very high miR-200b/c levels (for instance of exogenous source). C FACS plots showing the fluorescence intensity of HCT116 cells with FITC-A (Green) and PE-A (Red) channels after transfection with sensor plasmid in the presence of either pre-control or pre-miR-200c at 100 nM concentration. Indicated are the percent of gated cells over the total amount of cells in the experiment, including un-transfected. D FACS plots showing transfection of PANC-1 cells with RmutGmut or RwtGmut plasmids and bar graphs showing the percent of inhibition. E FACS plots showing transfection of SKOV3 cells with RmutGmut or RwtGmut plasmids and bar graphs showing the percent of inhibition. F Western blot quantification of ZEB1 and E-Cadherin protein expression of HCT116 cells with miR-200c knockout (MIR200C-KO), compared to parental cells. β-Actin was used as a loading control. G FACS plots showing the transfection of sensor plasmids in MIR200C-KO HCT116 cells or in parental control cells. H Bar graphs showing the percent of inhibition of FACS analysis done in (G). In D–E p values are from Student’s t test. In H p values are from two-way ANOVA. Points are average ± SD. *<0.05, **<0.01, ***<0.001, ****<0.0001.

