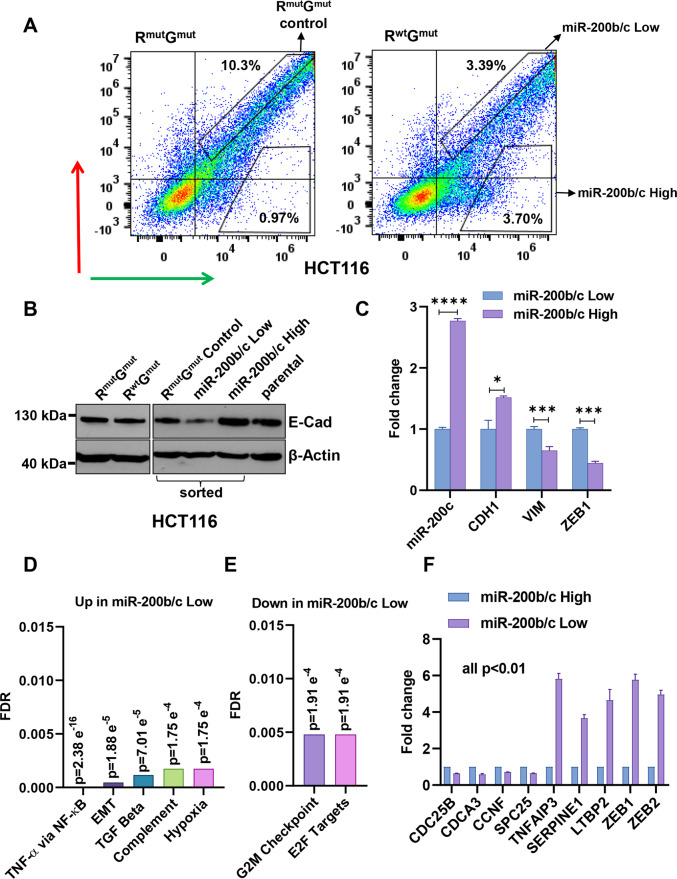
Fig. 2. The sensor can be used to sort cells by endogenous miR-200b/c levels.
A FACS plots showing the gates used for sensor-sorting miR-200b/c low and high cells after transfection with the RwtGmut plasmid (right panel). Left panel shows RmutGmut transfected control cells and their gate for sorting control. B Western blot quantification of E-Cadherin in HCT116 cells transfected either with RmutGmut or RwtGmut plasmids (unsorted, left panel), or sorted with the gates shown in (A) and re-plated for 3 days to grow and remove dead cells (right panel). C qPCR quantification of relative mRNA levels of CDH1 (gene coding E-Cadherin), VIM (Vimentin), ZEB1 and miR-200c in miR-200b/c low or high HCT116 cells sorted as in (A). Gene set enrichment analysis of RNA-sequencing data depicting pathways D upregulated and E downregulated in sensor-sorted miR-200b/c low cells compared to miR-200b/c high cells. F qPCR validation of RNA-sequencing data. CDC25B, CDCA3, CCNF, SPC25, TNFAIP3, SERPINE1, LTBP2, ZEB1 and ZEB2 were quantified using GAPDH as a housekeeping gene. p values are from Student’s t test. Points are average ± SD. *<0.05, **<0.01, ***<0.001, ****<0.0001.

