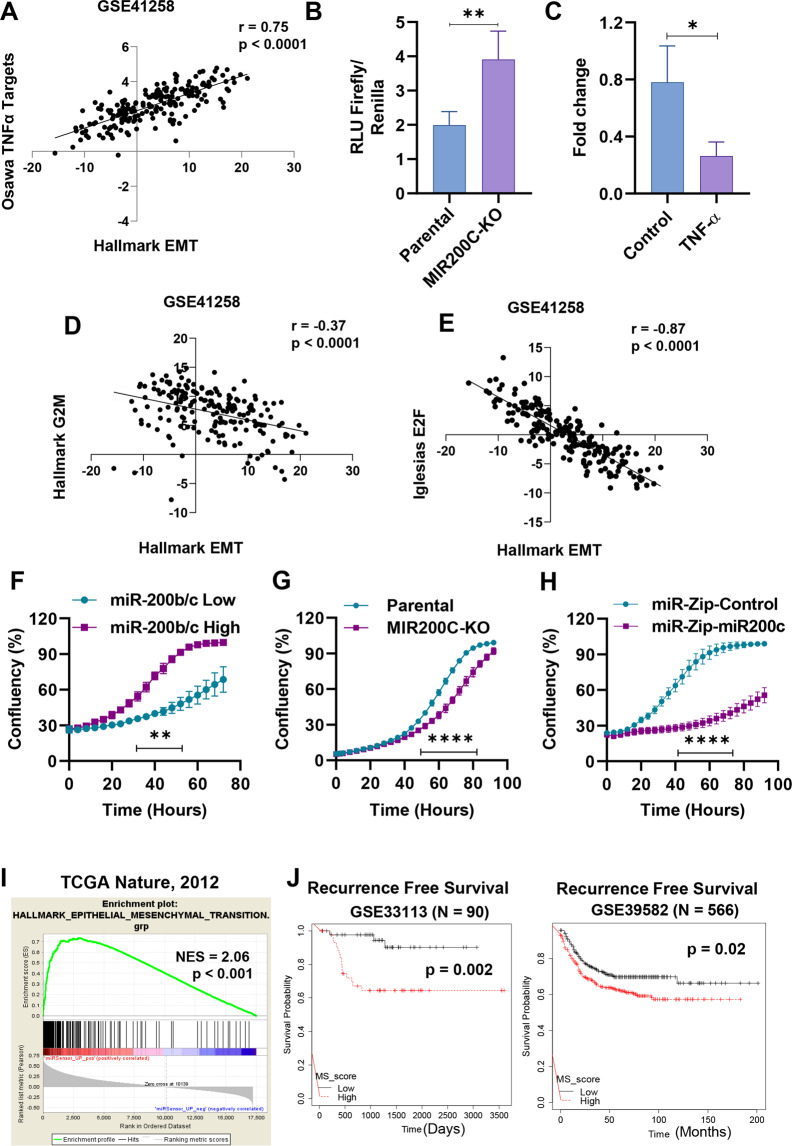
Fig. 3. miR-200b/c sensor-sorted cells can be used to molecularly characterize endogenous EMT states.
A Correlation between the z-scores of hallmark EMT and Osawa TNF-α targets in GEO dataset GSE41258. B Bar graphs showing the relative NF-κB activity (RLU Firefly/Renilla reporter assay) in parental and miR-200c KO (MIR200C-KO) HCT116 cells. C qPCR quantification of miR-200c levels in HCT116 cells after treatment with 30 ng/mL TNF-α. D Correlation between the z-scores of Hallmark EMT and Hallmark G2M targets in GSE41258. E Correlation between the z-scores of Hallmark EMT and Iglesias E2F targets in GSE41258. Real-time proliferation quantification in (F) FACS-sorted miR-200b/c high- and low-HCT116 cells, G Parental and MIR200C-KO HCT116 cells, and H HCT116 cells stably infected with either miR-Zip control or miR-Zip-200c. I Gene-set enrichment analysis of genes upregulated in miR-200b/c low cells with hallmark EMT gene-set in the indicated dataset using Pearson’s gene metric. J Kaplan–Meier analysis of recurrence-free survival in colorectal cancer patients (GSE33113 and GSE39582) based on the median value of MS score. p values in (J) are calculated using log-rank test. In B and C the p values are from Student’s t test. In F–H p values are from two-way ANOVA and Sidak’s multiple test. Points are average ± SD. *<0.05, **<0.01, ***<0.001, ****<0.0001.

