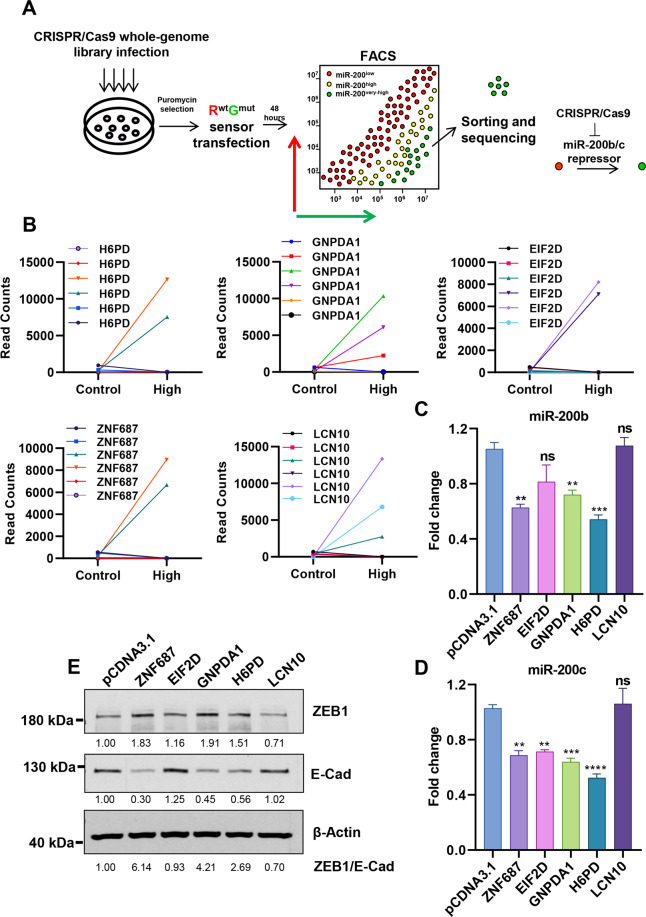
Fig. 4. The sensor can be used to identify miR-200b/c upstream regulators .
A Scheme showing the CRISPR-Cas9 screening strategy to identify miR-200b/c regulators using the miR-200b/c sensor. B Graphs showing read counts for the indicated genes’ gRNAs between sorted miR-200b/c high and control cells. Validation of the top hits from the CRISPR/Cas9 screen by qPCR. miR-200b (C) and miR-200c (D) levels were quantified in cells stably transfected with the cDNA clones overexpressing the hits genes, compared to the pCDNA3.1 vector control. E Western blot quantification of EMT markers ZEB1 and E-Cadherin in cells as in (C, D). ZEB1 and E-Cadherin band intensities were calculated by densitometry. β-Actin was used as a loading control. p values are from Student’s t-test. Points are average ± SD. *<0.05, **<0.01, ***<0.001, ****<0.0001.

