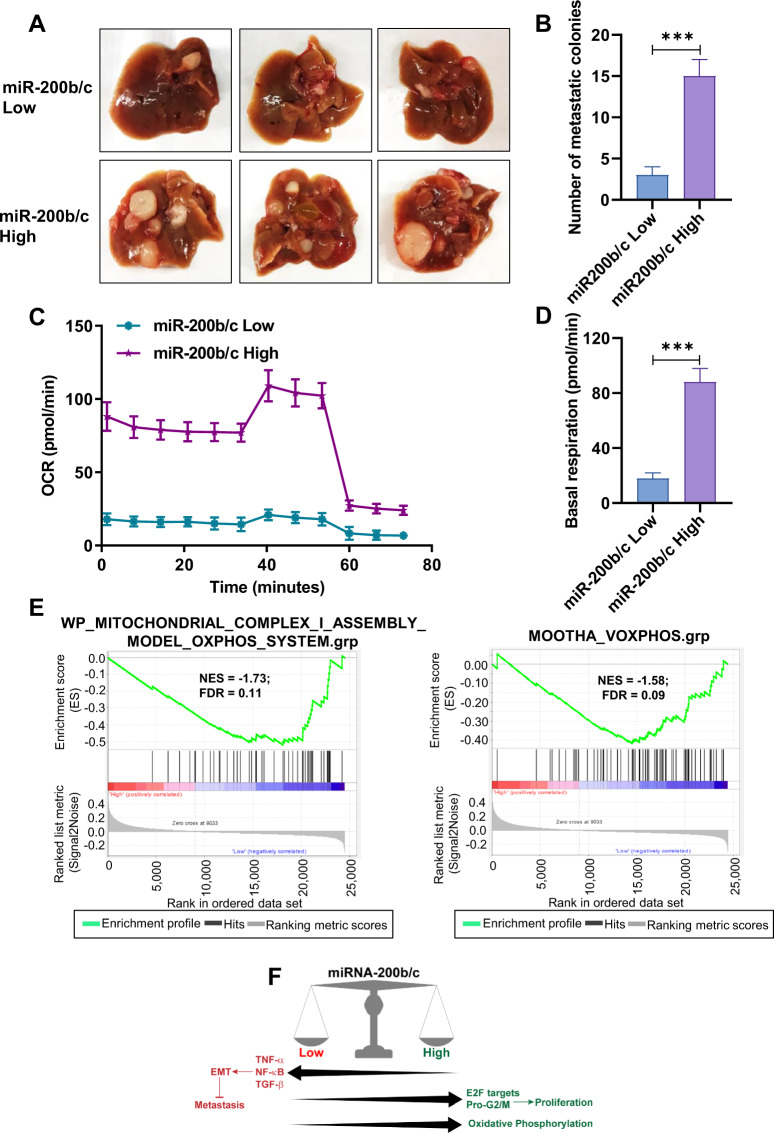
Fig. 5. miR-200b/c high and low cells have different metastatic and metabolic properties.
A Images of livers from NSG mice (n = 3) 5 weeks after injection of sorted HCT116 miR200b/c low or high cells, showing the metastatic colonies. B Bar graph showing the average metastatic colonies from (A) ±SD. C Oxygen Consumption Rate (OCR) measured by seahorse flux analyzer in HCT116 miR-200b/c low or high cells. D Bar graph showing basal respiration in HCT116 miR-200b/c low or high cells from (C). E Gene-set enrichment analysis of OXPHOS related genesets with the low and high categorized patient samples based on miR-200b/c sensor RNA-seq genes expression in the gene expression dataset GSE81980. GSEA was performed with the ranking of genes with signal2noise metric. F Scheme of the identified role of miR-200b/c as a molecular switch between EMT and proliferation. In B and D p values are from Student’s t test. Points are average ± SD. *<0.05, **<0.01, ***<0.001, ****<0.0001.

