
Figure 1.
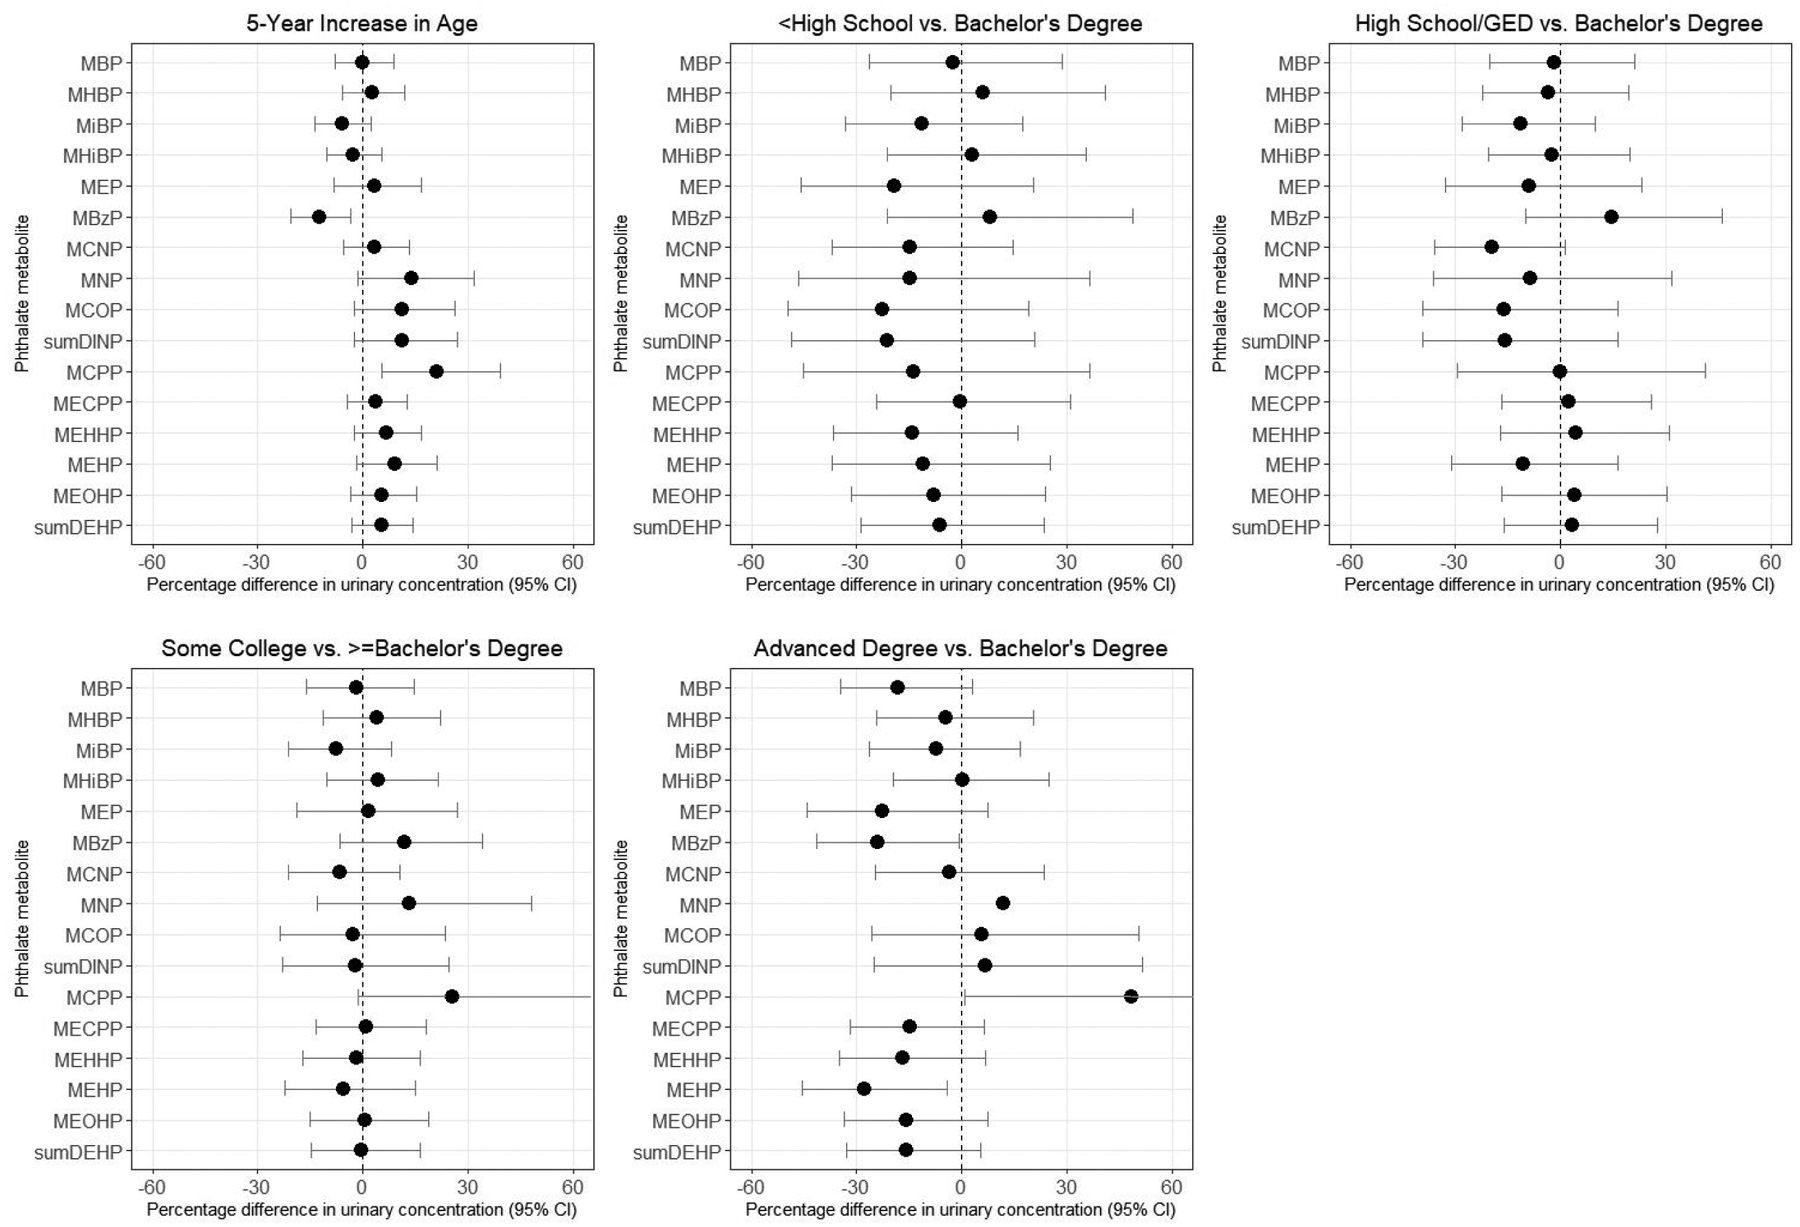
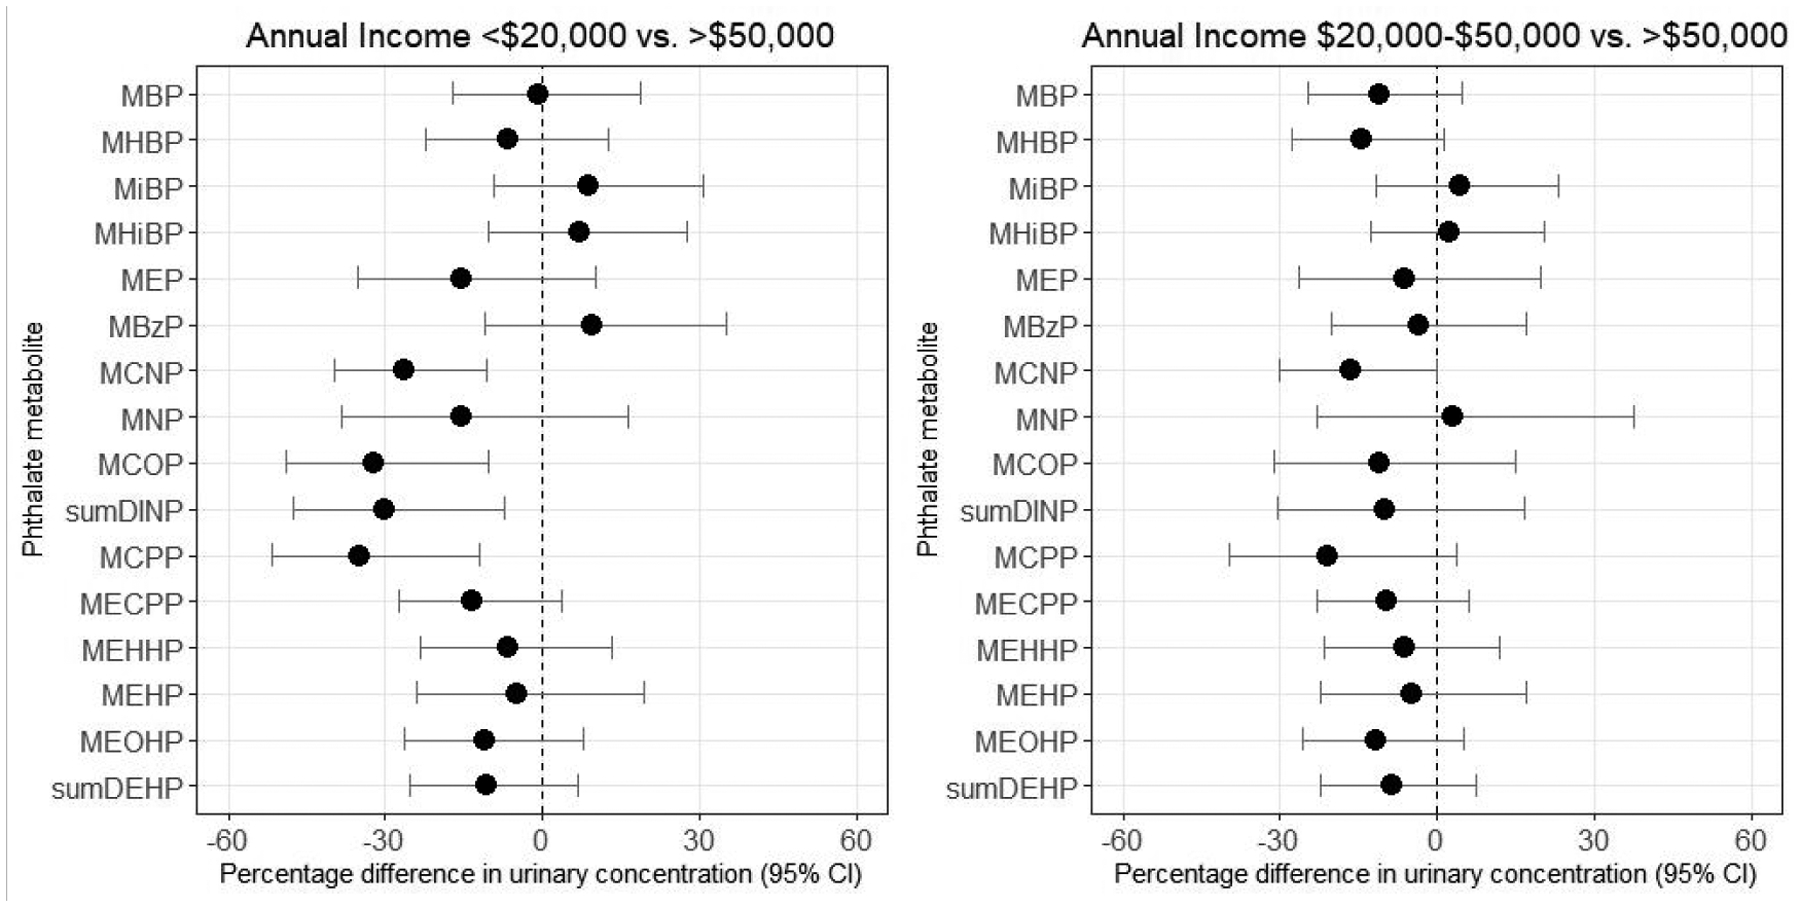
Percentage difference in baseline urinary phthalate concentrations by demographic variables, SELF. Estimates are adjusted for age, education, income, body mass index, smoking, alcohol intake, parity, current contraceptive use, and personal care product use in the past 24 hours. Note: confidence intervals are truncated at 60% in the graphs for education. Upper bounds for MCPP were 62.6% for some college vs. Bachelor’s degree and 116.4% for advanced degree vs. Bachelor’s degree.