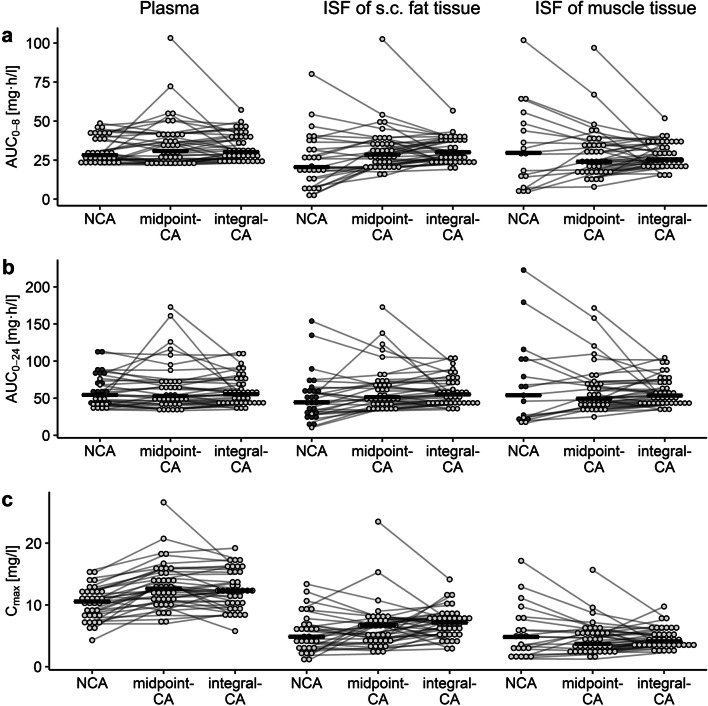
Fig. 4.
Comparison of individual area under the levofloxacin concentration-time curves from 0 to 8 h (AUC0–8) and 0–24 h (AUC0–24) and maximum concentration (Cmax) determined via noncompartmental analysis (NCA), dialysate-corrected mid-interval compartmental analysis (midpoint-CA) and dialysate-based integral compartmental analysis (integral-CA). Plasma exposure (left column) is expressed as total and exposure in the interstitial space fluid (ISF) of subcutaneous (s.c.) fat tissue (mid column) and in ISF of muscle tissue (right column) as unbound. Black line represents the median, grey lines connect exposure metrics from the same individual, dark grey dots represent individuals with fraction of AUC extrapolated until infitiy>20%

