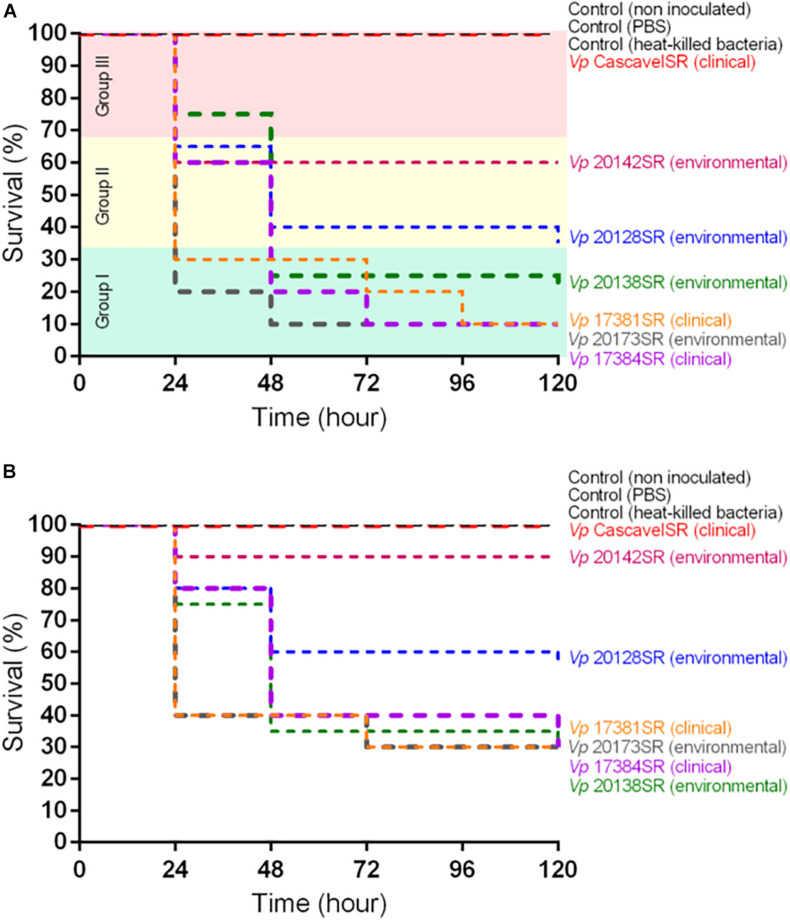
FIGURE 2.
Survival curves of Galleria mellonella larvae inoculated with (A) 104 CFU/larva and (B) 103 CFU/larva of each of the seven Vibrio parahaemolyticus strains. Each group contained n = 20 larvae per dose of each strain. Three controls, with n = 10 larvae per group, were used: non-inoculated, inoculated with phosphate-buffered saline, and heat-killed bacteria. Strains were grouped according to virulence: group I (green) – high; group II (yellow) – intermediate; and group III (red) – low. Survival curves of larvae in each group were generated using the Kaplan–Meier method (Kaplan and Meier, 1958) and compared using the log-rank test (Mantel, 1966; Peto and Peto, 1972), with p-values < 0.05 considered statistically significant.

