
Fig. 6.
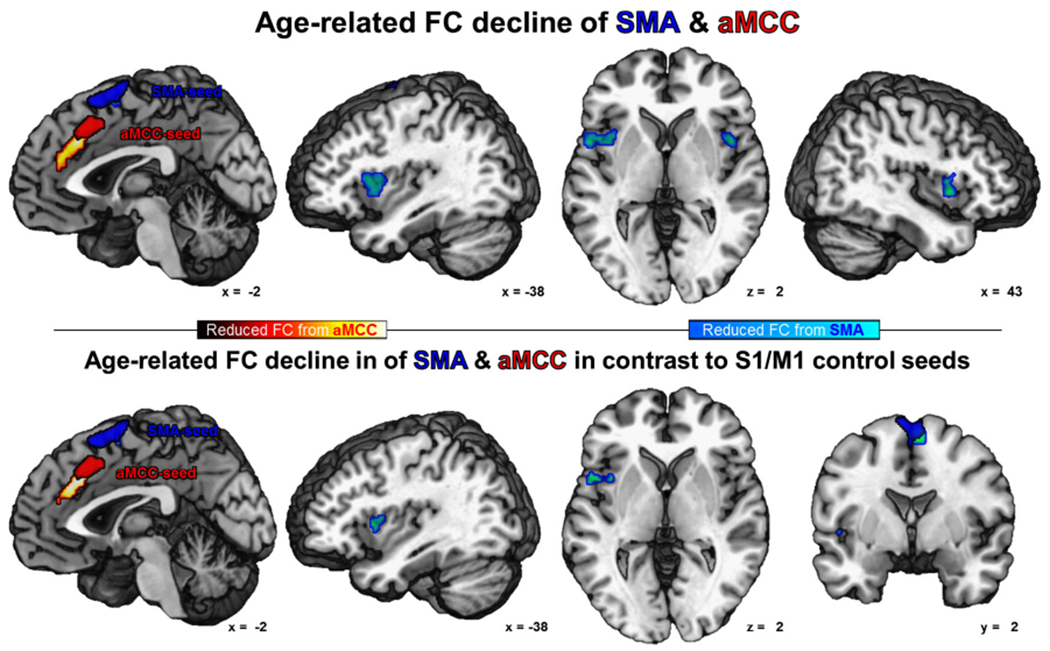
Age-related reduction of functional connectivity of the SMA (in blue) is shown in cold colors and of the aMCC (in red) is shown in warm colors (cFWE-corrected)
Official websites use .gov
A
.gov website belongs to an official
government organization in the United States.
Secure .gov websites use HTTPS
A lock (
) or https:// means you've safely
connected to the .gov website. Share sensitive
information only on official, secure websites.
Age-related reduction of functional connectivity of the SMA (in blue) is shown in cold colors and of the aMCC (in red) is shown in warm colors (cFWE-corrected)