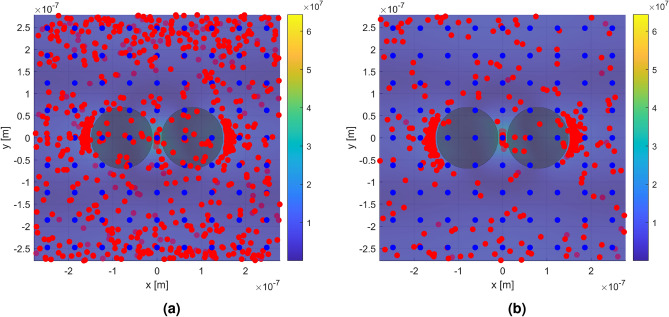
Figure 4.
Top view of a single unit cell illustrating the trapping effect of the local field enhancement. The color scale indicates the electric field magnitude. The blue dots represent the initial particle positions in a regular array. The red dots represent the particle positions after (a) 1 ms, and (b) 10 ms, under influence of the external field. Dots with a slightly darker color indicates that they are behind the plane where the field magnitude is shown. The external field was produced by a plane wave incident from above with wavelength 785 nm and power 50 mW μm, polarized along the axis through the centers of both nanoantennas (x-axis). The number of particles in initial positions appears lower due to their vertical alignment (along z) in the array19. The distributions of particles distance from the hotspot are shown in the Supporting Information.

