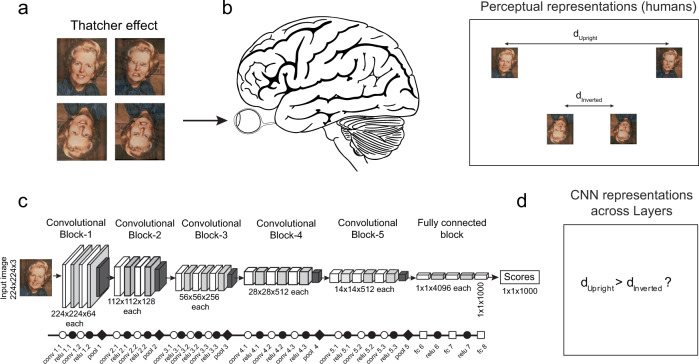
Fig. 1. Evaluating whether deep networks see the way we do.
a In the classic Thatcher effect, when the parts of a face are individually inverted, the face appears grotesque when upright (top row) but not when inverted (bottom row). Figure credit: Reproduced with permission from Peter Thompson. b When the brain views these images, it presumably extracts specific features from each face so as to give rise to this effect. We can use this idea to recast the Thatcher effect as a statement about the underlying perceptual space. The distance between the normal and Thatcherized face is larger when they are upright compared to when the faces are inverted. This property can easily be checked for any computational model. Brain Image credit: Wikimedia Commons. c Architecture of a common deep neural network (VGG-16). Symbols used here and in all subsequent figures indicate the underlying mathematical operations perfomed in that layer: unfilled circle for convolution, filled circle for ReLu, diamond for maxpooling and unfilled square for fully connected layers. Unfilled symbols depict linear operations and filled symbols depict non-linear operations. d By comparing the distance between upright and inverted Thatcherized faces, we can ask whether any given layer of the deep network sees a Thatcher effect.

