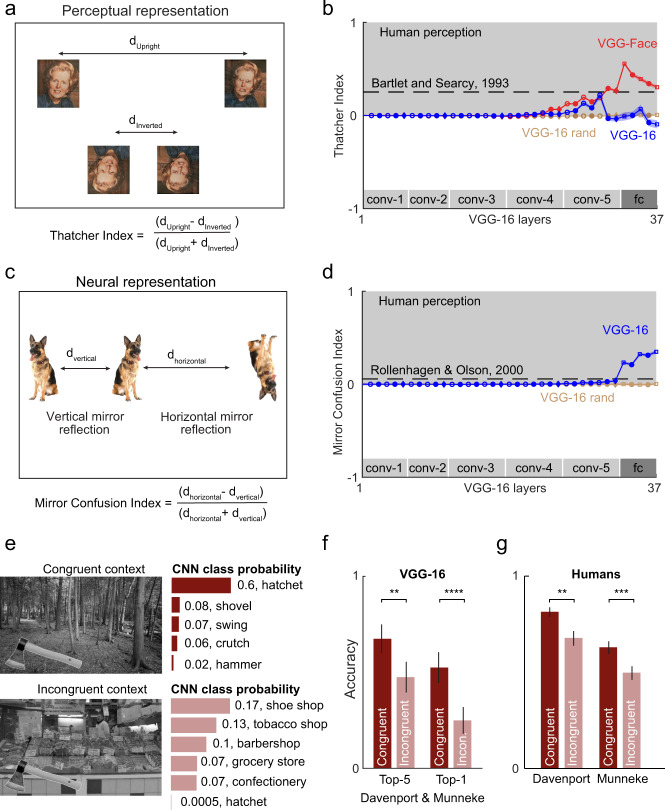
Fig. 2. Object and scene regularities in deep networks.
a Perceptual representation of normal and Thatcherized faces in the upright and inverted orientations. b Thatcher index across layers of deep networks. For deep networks, we calculated the Thatcher index using Thatcherized faces from a recently published Indian face dataset (see the “Methods” section) across layers for the VGG-16 (blue), VGG-face (red), and a randomly initialized VGG-16 (brown). Error bars indicate s.e.m. across face pairs (n = 20). The grey region indicates human-like performance. Dashed lines represent the Thatcher index from a previous study14, measured on a different set of faces (see the “Methods” section). c Neural representation of vertical and horizontal mirror images. Vertical mirror image pairs are closer than horizontal mirror image pairs. d Mirror Confusion Index (averaged across all objects) across layers for the pretrained VGG-16 network (blue) and a VGG-16 network with random weights (brown). Error bars indicates s.e.m. across stimuli (n = 50). Dashed lines represent the mirror confusion index estimated from monkey inferior temporal (IT) neurons in a previous study18. e An example object (hatchet) embedded in an incongruent context (forest) and in a congruent context (supermarket). The class probability returned by the VGG-16 network is shown beside each image for the top five guesses and for the correct object category (hatchet). f Accuracy of object classification by the VGG-16 network for congruent (dark) and incongruent (light) scenes, for top-5 accuracy (left) and top-1 accuracy (right). Error bars represent s.e.m. across all scene pairs (n = 40). Asterisks indicate statistical significance computed using the Binomial probability of obtaining a value smaller than the incongruent scene correct counts given a Binomial distribution with the congruent scene accuracy (** is p < 0.01, **** is p < 0.001). g Accuracy of object naming by humans for congruent (blue) and incongruent (red) scenes across two separate studies19,20. Error bars and statistical significance are taken from these studies (Davenport Set: ** indicates p < 0.01 for the main effect of congruence in a within-subject ANOVA on accuracy; Munneke Set: *** indicates p = 0.001 for accuracy in paired t-test).

