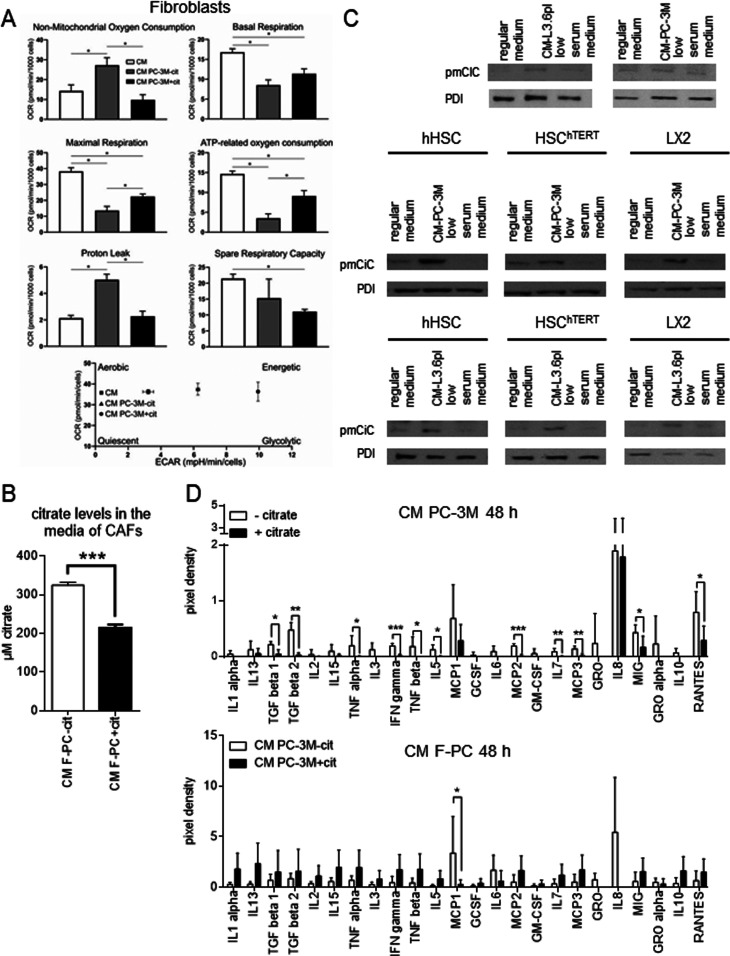
Figure 1. Cancer-associated fibroblasts release citrate through pmCiC.
(A) Seahorse analysis of the metabolic characteristics and the energy map of fibroblasts grown in media used for conditioning, CM PC-3M−cit or CM PC-3M+cit (n = 4). The graphs show differences between normal fibroblasts (white), fibroblasts transformed with CM PC-3M−cit (grey), and CM PC-3M+cit (black). (B) The graph depicts citrate levels in the media from fibroblasts stimulated with CM PC-3M−cit (white) and CM PC-3M+cit (black). (C) pmCiC expression in fibroblasts and different hepatic stellate cell lines grown in regular medium, low serum medium or transformed with conditioned media from PC-3M cells or L3.6pl cells. (D) The graphs show selected cytokines (n = 5) released from PC-3M cancer cells preincubated without or with extracellular citrate for 48 h (CM PC-3M−cit CM PC-3M+cit, respectively; upper panel) and human primary skin fibroblasts transformed by CM PC-3M−cit CM PC-3M+cit (CM F-PC−cit and CM F-PC+cit, respectively; lower panel).

