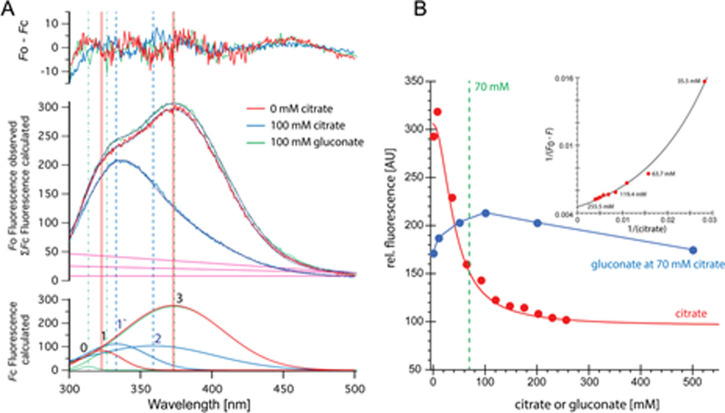
Figure S9. Trp quenching at different concentrations of citrate.
(A) Titration with citrate and gluconate in presence of 70 mM citrate (blue) is shown as raw data and deconvoluted spectra. (B) Changes in relative fluorescence and similar changes depicted in a Benesi–Hildebrand (double reciprocal) plot of citrate data are shown. Similar to the Lineweaver–Burk linearization method, only data that satisfy a 1:1 binding model with a constant Kd result in a linear dependency—the data clearly deviate from this model.

