
Figure 5. Task 3—Scaling and batch limits.
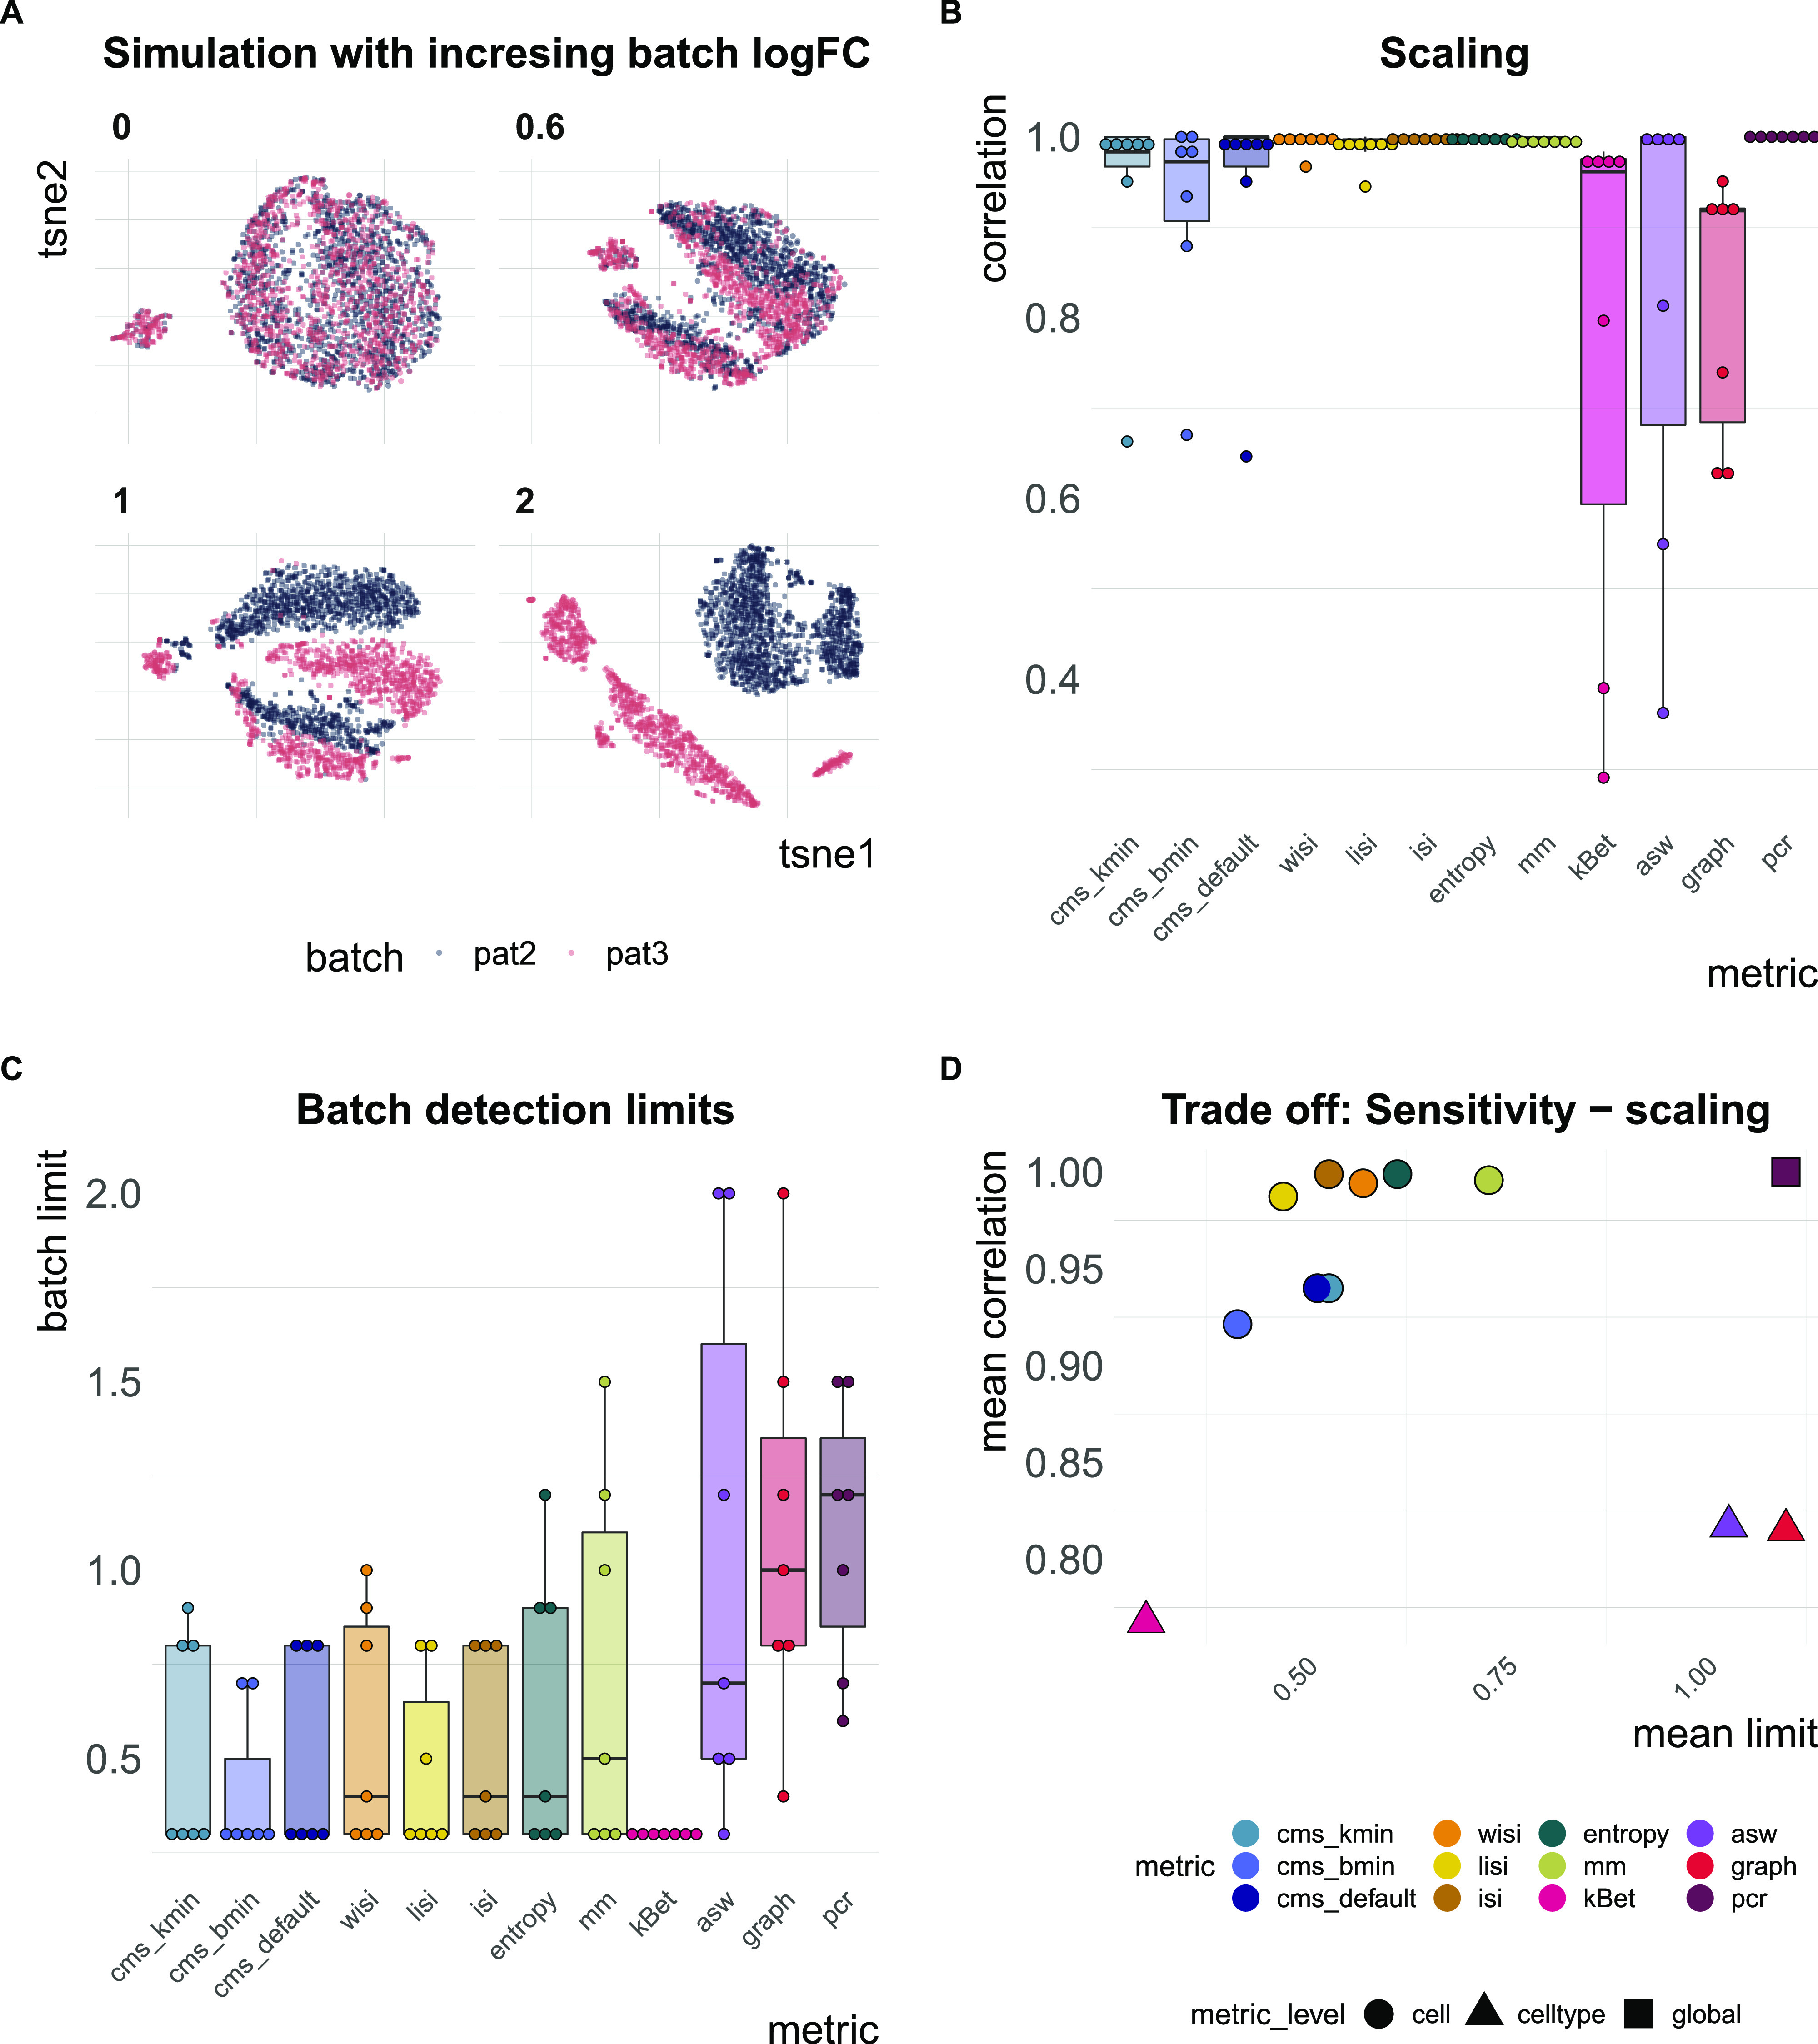
(A) A 2D tSNE projection of simulation series with increasing batch logFC factors (θb from Equation (3); for example, a factor of 0 represents a batch-free dataset). (B) Boxplots of Spearman correlation coefficients of the metric scores and the relative batch strength for all seven simulation series. (C) Boxplots of batch limits, defined as the smallest batch logFC factors such that metrics differ more than 10% from the batch-free score. A small batch limit indicates high sensitivity to detect variation related to the batch variable. (D) Trade-off between batch detection sensitivity (batch limits) and scaling with batch strength. Shapes refer to metric types.