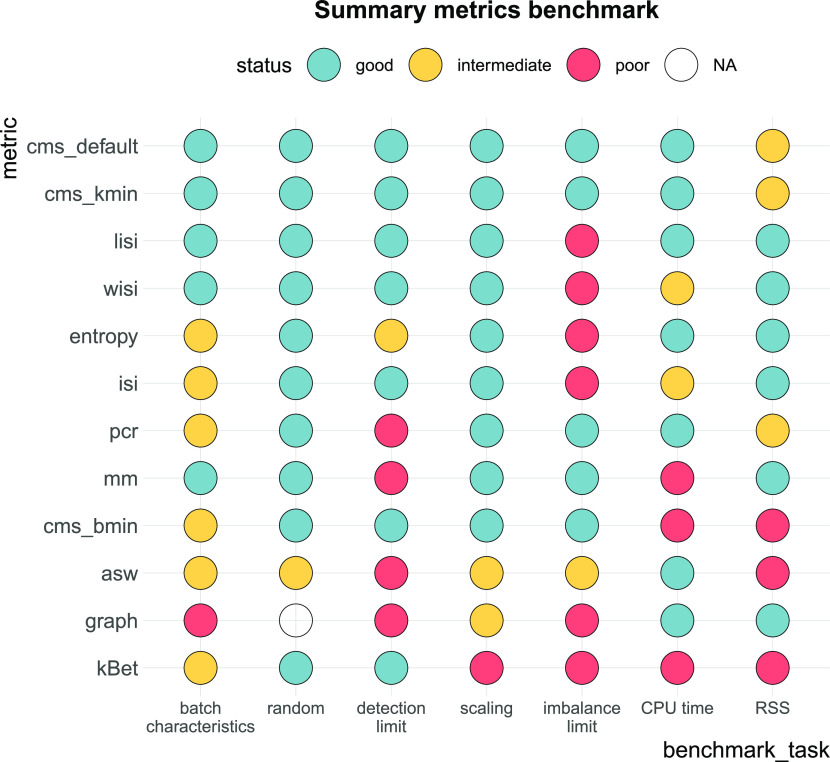
Figure 8. Benchmark summary.
Metric performance and ranking by benchmark task. Methods are ranked by their overall performance from top to bottom (numerical encoding good = 2, intermediate = 1, poor/NA = 0). Following thresholds for good and intermediate were used: batch characteristics and random: Spearman correlation coefficients ≥0.75, ≥0.5; scaling: Spearman correlation coefficient ≥0.9, ≥0.8; detection limits of ≤0.6, ≤0.7; imbalance limits ≥0.9, ≥0.75; CPU time ≤1, ≤2 h; RSS ≤50 GB, ≤70 GB.

