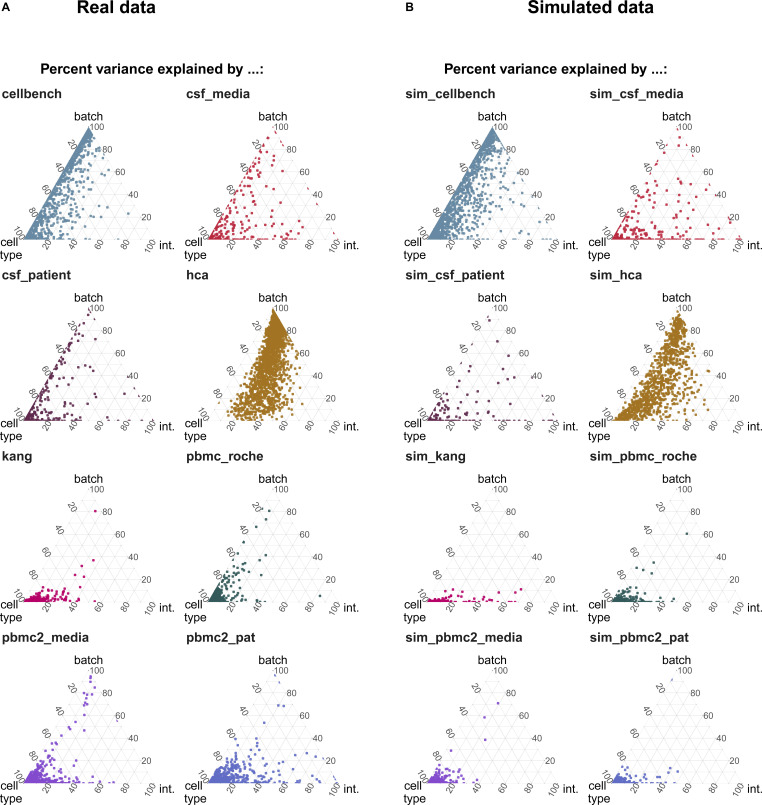
Figure S6. Comparison of variance partitions between simulations and their corresponding real data reference.
(A, B) Variance explained by batch, cell type and the interaction of cell type and batch in the real datasets (A) and the corresponding simulated datasets (B). In these simulations, the batch logFC factors are set to one, thus simulations mimic their respective real data reference.

