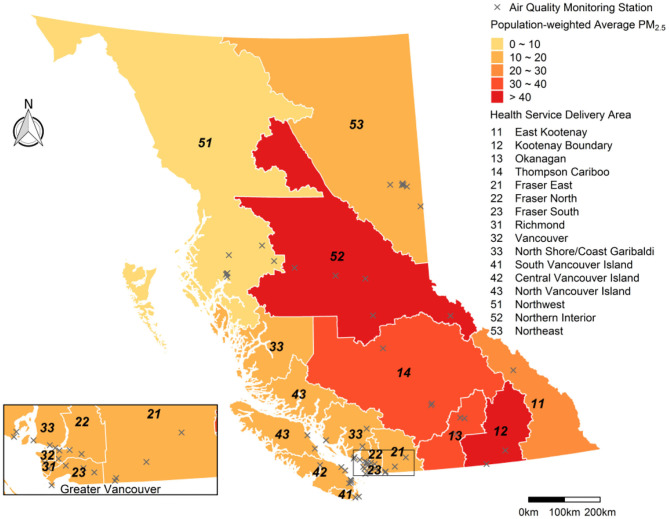
Figure 2.
Map of British Columbia showing the 16 Health Service Delivery Areas (HSDAs) in the study area. The HSDAs are color-coded to show the population-weighted average of fine particulate matter (PM2.5) concentrations during the study period (15 July−15 September 2018) from the Optimized Statistical Smoke Exposure Model (OSSEM). Locations of the 62 regulatory air quality monitoring stations are also shown.

