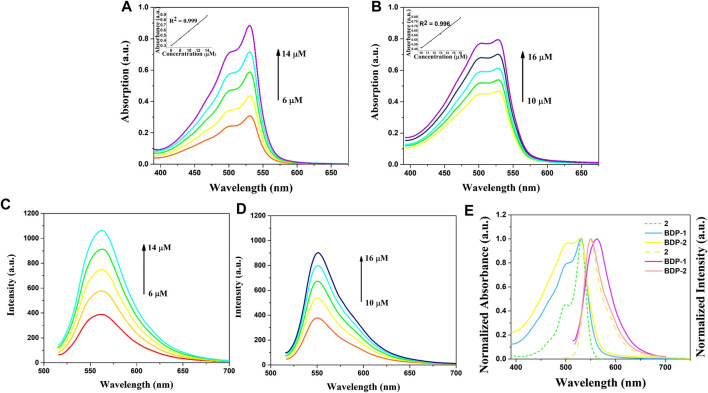
FIGURE 1.
Absorption and emission spectra of BDP-1 and BDP-2. Absorption spectra of (A) BDP-1 and (B) BDP-2 in methanol at 25°C. Emission spectra of (C) BDP-1 and (D) BDP-2 in methanol at 25°C. (concentration BDP-1: 6, 8, 10, 12, 14 μM; BDP-2: 10, 11.5, 13, 14.5, 16 μM). (E) Normalized spectrum of 2, BDP-1 and BDP-2. Insert: The absorption changes upon the increasing concentration.

