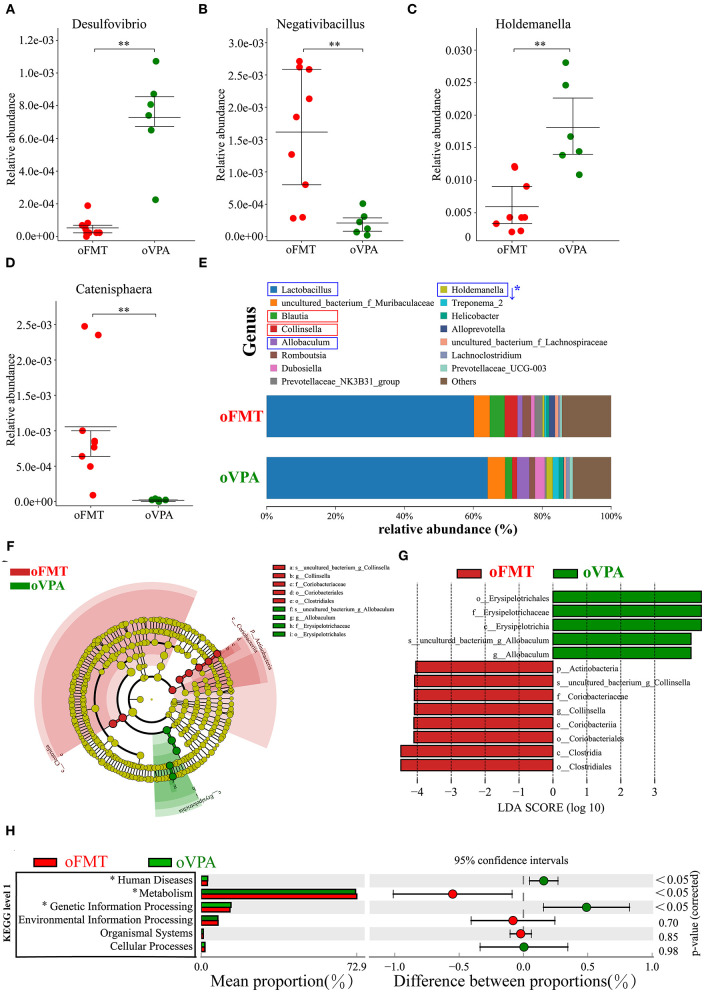
Figure 6.
The changes in the gut microbiota composition between oFMT and oVPA according to the 16S rRNA data. Impact of FMT on gut microbiota (cecal and fecal microbiota) in offspring rats (oFMT, n = 9; oVPA, n = 6) (red: oFMT; green: oVPA). **P < 0.01 compare with the oCON. (A–D) To investigate the differences in microbial community abundance between oFMT and oVPA, t-test was performed on species abundance data at the Genus level by Metastats analysis. Finally, the species causing the difference in sample composition between the two groups were screened according to the corrected P-value. (E) The gut microbiota species distribution analysis in the Genus. The microbiota has a significant difference in microbial community abundance between oFMT and oVPA (Metastats analysis) (*P < 0.05). Red “↑” shows the relative abundance increased, and blue “↓” means decreased. (F,G) The histogram of LDA value distribution and the evolutionary branch diagram of LEfSe analysis show the species whose LDA Score is higher than the set value (LDA score >4.0, P < 0.05). The histogram's length represents the impact size of different species (LDA Score), and different colors represent the species in different groups. (H) Difference analysis of KEGG metabolic pathway in oFMT and oVPA at the first level. The left is the proportion of the abundance of different functions in two groups of samples; in the middle is the proportion of the difference in the abundance of different functions in the 95% confidence interval; on the far right is the corrected P-value.

