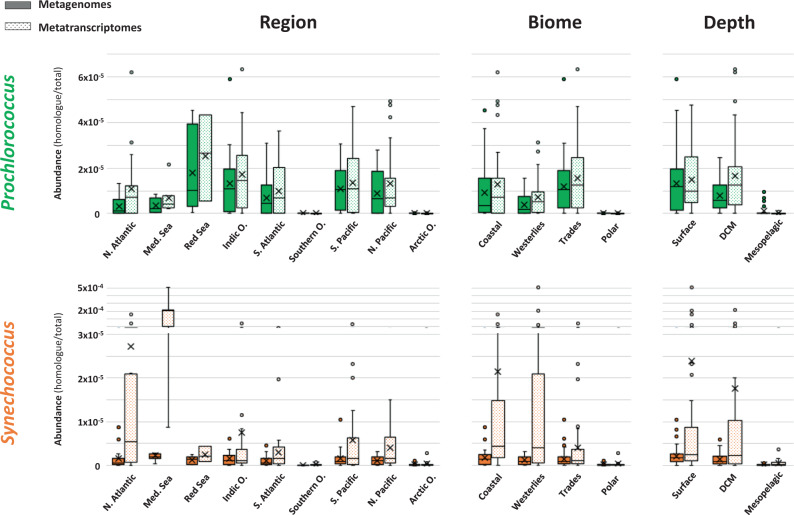
Fig. 3. Distribution of PilA1 amongst marine ecosystems.
Whisker box plots showing pilA1 gene abundance in Prochlorococcus (green) and Synechococcus (orange) in metagenomes (solid bars; nmg = 174) and metatranscriptomes (dotted bars; nmt = 178) generated from all filters (0.2–3 µm) obtained from 125 sampling stations of the TARA Oceans global marine survey. Abundance was calculated by dividing the sum of the abundances of pilA1 homologs assigned to each genus by the sum of total gene abundance from all reads from the sample. Data are presented by oceanic region (North Atlantic Ocean, nmg = 23, nmt = 21; Mediterranean Sea, nmg = 12, nmt = 7; Red Sea, nmg = 6, nmt = 3; Indic Ocean, nmg = 27, nmt = 22; South Atlantic Ocean, nmg = 19, nmt = 19; Southern Ocean, nmg = 4, nmt = 8; South Pacific Ocean, nmg = 31, nmt = 41; North Pacific Ocean, nmg = 16, nmt = 25; Arctic Ocean, nmg = 36, nmt = 32), biome (Coastal, nmg = 35, nmt = 33; Westerlies, nmg = 37, nmt = 28; Trades, nmg = 62, nmt = 103; Polar, nmg = 40, nmt = 40) and water depth (surface, nmg = 62, nmt = 78; deep chlorophyll maxima (DCM), nmg = 43, nmt = 39; mesopelagic layers, nmg = 29, nmt = 21). Filters from polar regions were excluded from the depth abundance analysis. Whiskers indicate variability outside the upper and lower quartiles (boxes). Exclusive median (line), average (cross) and atypical values (circles) are also indicated. Source data are provided as a Source Data file.

