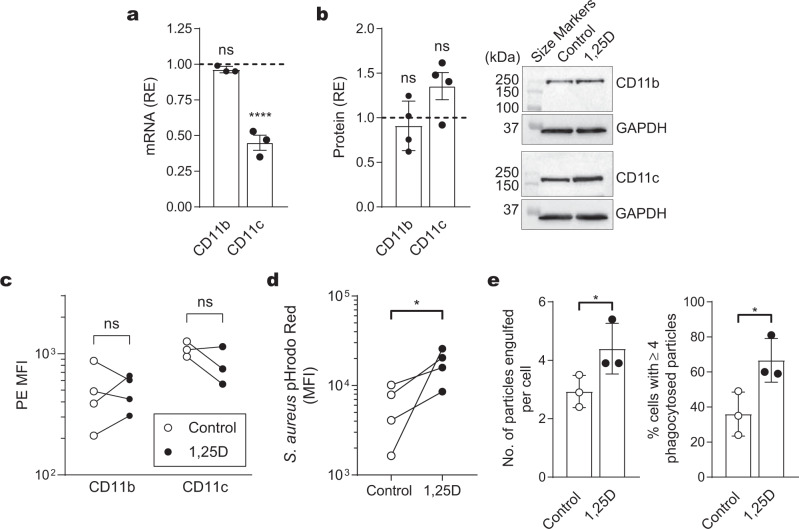
Fig. 2. Effect of 1,25D on macrophage CR3 and CR4 expression and phagocytosis.
Monocytes were cultured for either 3 days (for mRNA expression) or 5 days (for protein expression) with 1,25D and examined for complement receptor expression. Relative expression (RE) of mRNA or protein was measured against GAPDH. a Macrophages were examined for CD11b and CD11c mRNA expression. Data are expressed as fold-change compared with untreated control from three experiments each conducted with cells from a different individual and expressed as mean ± s.d. b Macrophages were examined for CD11c and CD11b protein expression by western blotting, normalized against GAPDH from four experiments each with cells from a different individual. Representative western blots are shown. c Macrophages were analysed for CD11b and CD11c surface expression by flow cytometry. The PE MFI values are shown of four (CD11b) and three (CD11c) experiments, each conducted with cells from a different individual. d Phagocytosis of S. aureus bioparticles by macrophages as measured by the pH-sensitive pHrodo™ Red dye. Data are expressed as MFI, each conducted with cells from a different individual. e Phagocytosis of opsonized C. albicans by macrophages derived from monocytes cultured in either the presence or absence of 100 nM 1,25D for 5 days, is expressed as the number of engulfed particles per cell (left graph) and the percentage of cells with four or more phagocytosed particles (right graph). Data are presented as mean ± s.d. of three experiments each with cells from a different individual. a, b Data are presented as mean ± s.d. P values were calculated using one-way ANOVA followed by Dunnett’s multiple comparison test. c–e P values were calculated using paired two-tailed (c) or one-tailed (d, e) Student’s t-test. Significance of differences between 1,25D versus control, *P < 0.05, ****P < 0.0001, ns = not significant.

