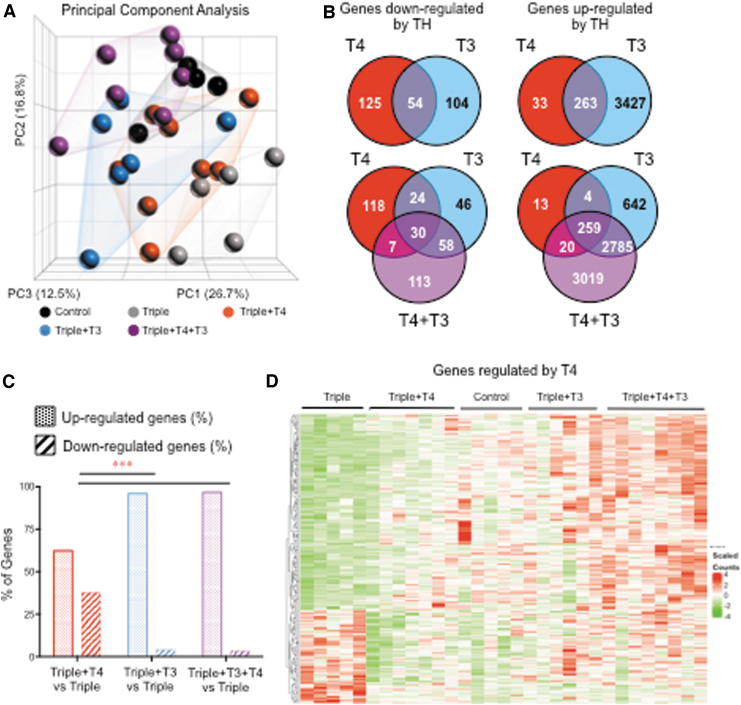
FIG. 2.
RNA sequencing results in the liver from mice at P15. (A) Principal component analyses of data from individual samples. (B) Venn diagram of upregulated and downregulated genes in the different TH-treated Triples vs. Triples treated with vehicle (p < 0.01). (C) Percentage distribution of upregulated and downregulated genes in the different TH-treated groups. (D) Heat map of genes significantly regulated by T4 based on a p < 0.01. ***p < 0.001 as determined by chi-square test.

