FIG. 7.
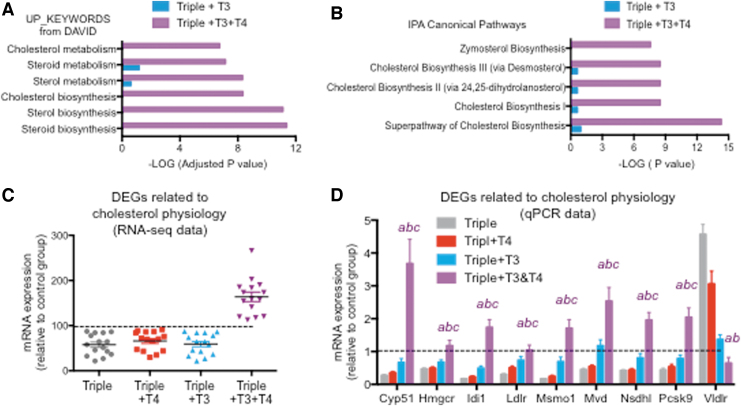
Specific effects of the T3+T4 treatment on cholesterol physiology genes. (A) Statistical significance of DAVID terms related to cholesterol in 535 genes affected by T3 compared with 535 top genes affected by T3+T4 treatment. (B) Statistical significance of IPA canonical pathways related to cholesterol in 535 genes affected by T3 compared with 535 top genes affected by T3+T4. (C) RNA-sequence data as a percentage of control values of genes identified by IPA as related to the superpathway of cholesterol biosynthesis. (D) qPCR validation of most genes shown in (C). “abc” indicate p < 0.05 triples+T3+T4 vs. triples, triples+T4, and triples+T3, respectively, as determined by ANOVA and Fisher's LSD test. Dotted lines indicated control values (D1/D2KOPax8Het). Significance for triple+T3 and triple 4 groups is not indicated. Data for Vldlr are not shown in (C).

