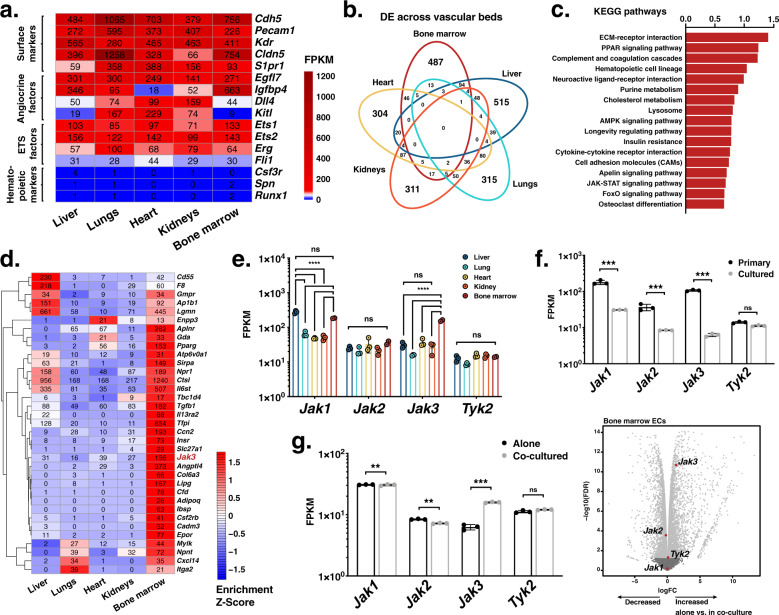
Fig. 1. Endothelial expression of Jak3 is enhanced by a hematopoietic milieu in vitro and in vivo.
a Heatmap depicting absolute transcript abundances of genes of interest obtained by RNA sequencing (RNA-seq) of primary murine endothelial cell (EC) populations extracted from the indicated vascular beds. Average FPKM values for all biological replicates (n = 2 or 3 per organ) appear in black. b Venn diagram showing number of intersecting overrepresented gene transcripts resulting from differential expression analyses of each vascular bed against all other samples (FDR < 0.05). c Bar plot of enrichment scores of the 15 most upregulated Kyoto Encyclopedia of Genes and Genomes (KEGG)54–56 terms generated by gene set enrichment analysis (GSEA) using the log2 fold change of the differentially expressed gene transcripts in the bone marrow vasculature compared to that of the liver, lungs, heart, and kidneys. d Heatmap depicting normalized transcript abundances of genes that contributed to the 15 most upregulated KEGG terms by GSEA. Average FPKM values for all biological replicates (n = 2 or 3 per organ) appear in black. Jak3, the most highly and differentially expressed transcript, is highlighted in red. e Janus kinase (Jak) family gene expression across the organs assayed as measured by RNA-seq. ****p value < 0.0001 and ns (not significant) > 0.05, by two-way ANOVA. f Jak family transcript expression in primary vs. cultured bone marrow ECs (BMECs) as measured by RNA-seq (n = 3 per group). Raw data were obtained from Poulos et al.26 (GEO: GSE61636) and re-analyzed for this publication. ***p value < 0.001 and ns > 0.05, by unpaired, two-tailed Student’s t test. g Jak family transcript expression in BMECs cultured alone vs. in contact with hematopoietic stem and progenitor cells for 8 days as measured by RNA-seq (n = 3 per group; left). Volcano plot illustrating differential expression analysis of these data (right). Jak family gene transcripts are highlighted with enlarged dots in red; respectively, light or dark gray dots indicate gene transcripts differentially expressed above or below cutoffs, –log10 (p value) < 1 and |log2FC| < 2.5. Raw data were obtained from Poulos et al.26 (GEO: GSE61636) and re-analyzed for this publication. ***p value < 0.001, **p value < 0.01, and ns (not significant) > 0.05, by unpaired, two-tailed Student’s t test. On all plots, each replicate is represented by an individual dot and error bars represent standard deviation from the mean.

