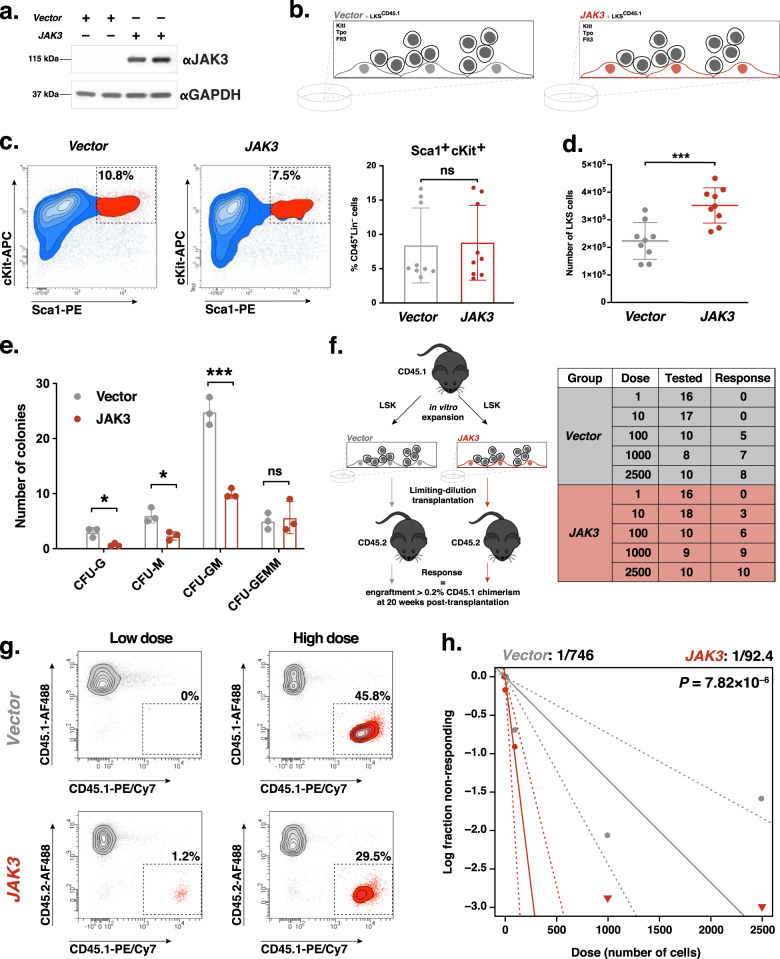
Fig. 3. JAK3 overexpression in endothelial cells (ECs) provides an expansion advantage to hematopoietic stem cells during in vitro co-culture.
a Western blot of Vector- or JAK3-transduced human ECs for in vitro co-culture experiments (n = 2). b Schematic depiction of co-culture setup. CD45.1+Lineage–cKit+Sca1+ (LKS) cells were plated onto confluent monolayers of Vector- (gray) or JAK3- (red) transduced ECs under serum-free conditions and in the presence of Kitl, Tpo, and Flt3 for 8 days. c Representative flow cytometry plots depicting endpoint LKS cell expansion experiment gated on CD45.1+Lineage– live single cells (left and center; n = 9). LKS cell percentages were averaged (right). d Total number of LKS cells following expansion as gated on DAPI–CD45.1+Lineage– live single cells (n = 9). Center lines represent the average number of cells. e Quantification of colony-forming unit (CFU) assays using expanded LKS cells measuring CFU-granulocytic (CFU-G), CFU-monocytic (CFU-M), CFU-granulocytic/monocytic (CFU-GM), and CFU granulocytic/erythrocytic/macrophagic/megakaryocytic (CFU-GEMM) potential (n = 3). f Schematic depiction of transplantation setup (left). CD45.1+ LKS cells were expanded onto Vector- or JAK3-transduced ECs, then transplanted into CD45.2+ recipients in a limiting-dilution manner. Positive engraftment was deemed as 0.2% and higher donor chimerism at experiment endpoint (20 weeks post-transplant. Results summary table (right) where the Group column refers to the cells used in co-culture, the Dose column refers to the number of LKS cells transplanted in each mouse, the Tested column refers to the number of mice that survived to experiment endpoint (week 20), and the Response column refers to the number of engraftment mice at experiment endpoint. g Representative flow cytometry plots depicting endpoint chimerism after co-culture with Vector- (gray) or JAK3- (red) transduced ECs and transplantation into lethally irradiated recipients in a limiting-dilution manner (n = 5 or 10 mice per dosage cohort). Plotted events were gated on DAPI– single cells. Low and high doses correspond to initial injections of 10 and 1000 LKS cells, respectively. h Log-fraction plot of limiting dilution analysis showing the frequency of long-term multilineage engraftment following limiting-dilution assay. Dashed lines indicate 95% confidence intervals. Stem cell frequency and statistics were determined using Extreme Limiting Dilution Analysis. ***p value < 0.001, *p value < 0.05, and ns (not significant) > 0.05, by unpaired, two-tailed Student’s t test. On all plots, each replicate is represented by an individual dot. All error bars represent the standard deviation from the mean.

