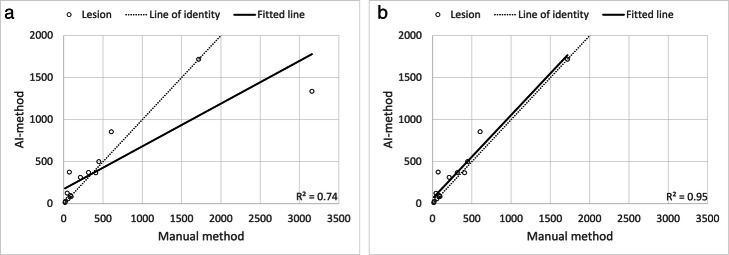
Fig. 5.
a Scatter plot showing manually measured TLG plotted against measurements made by the AI-method in the test group. The largest measured data point show much greater difference between the two methods compared to the smaller measurements; analysis of this individual lesion shows different morphology and localisation adjacent to the heart which caused underestimation with the AI-method (42% of ground truth). This may indicate that the AI-method underperforms in large complex lesions that are adjacent to the heart. b Scatter plot showing manually measured TLG plotted against measurements made by the AI-method in the test group with removed outlier described in (a)

