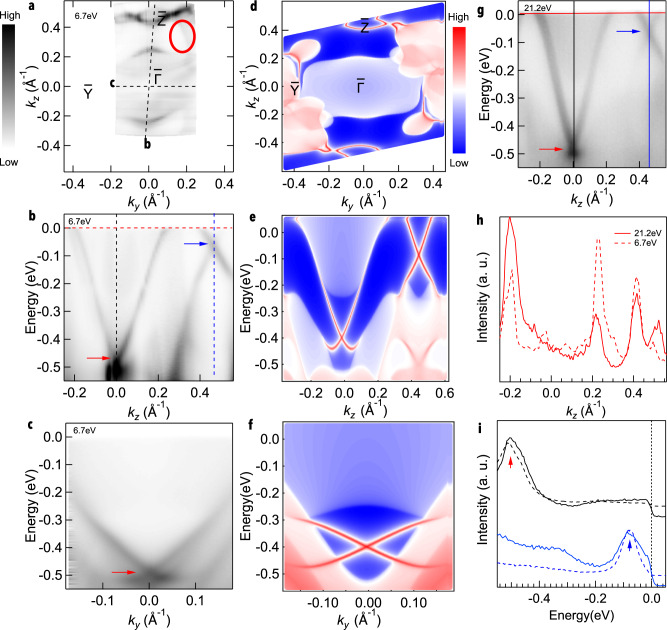
Fig. 2. Experimental and calculated Fermi surface and band dispersion of RhBi2 at T = 40 K.
a Fermi surface plot of the ARPES intensity integrated within 10 meV of the chemical potential and measured with photon polarization along - direction. b Band dispersion along the - line. c Band dispersion along -. d DFT calculations of Fermi surface. e–f DFT calculations of energy dispersion corresponding to the ARPES data (b) and (c), respectively. g band dispersion along - measured using photon energy of 21.2eV, unpolarized. h Momentum distribution curves (MDCs) at the chemical potential at photon energy 6.7 ev and 21.2 eV. i Energy distribution curves (EDCs) at the and in two different photon energy. Red arrow marks position of the surface Dirac point at (kz = 0 Å−1) and blue one marks the position at the (kz = 4.5 Å−1). Dashed lines are extracted at a photon energy 6.7 eV and sloid ones are extracted at 21.2 eV.

