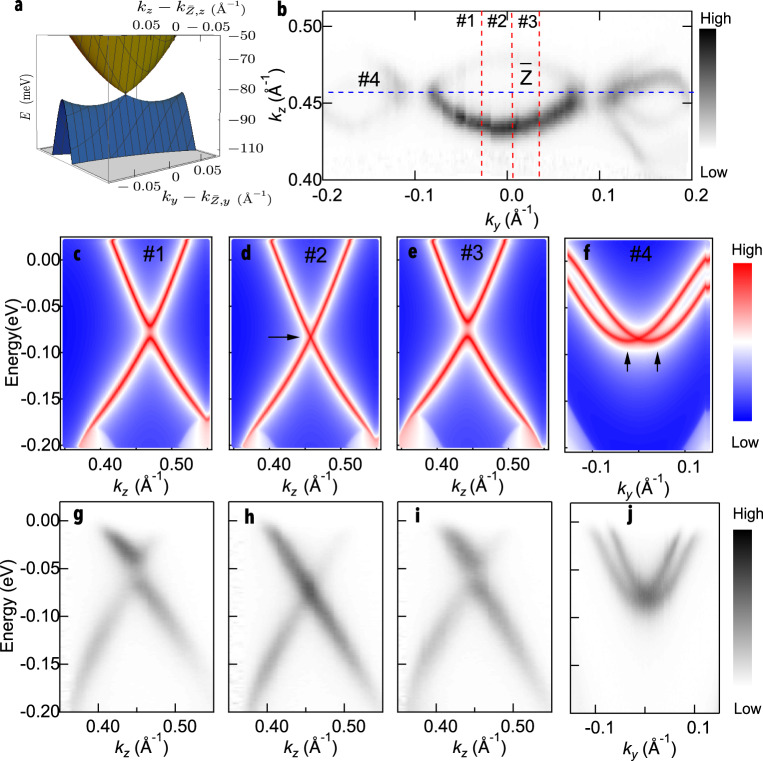
Fig. 3. Saddle points and Dirac dispersion around the point.
a, k ⋅ p model band dispersion around the point, revealing a nodal point, two saddle points and the almost-flat region of the lower energy band at slightly lower energies. The two saddle points at energy − 83 meV are responsible for the logarithmic divergence of the DOS. b Fermi surface plot of the ARPES intensity integrated within 10 meV of the chemical potential around the point. Dark areas mark location of the FS. c–f Calculated band dispersion along the vertical direction in (b) that is marked as red dashed lines (#1-3), respectively. f Calculated band dispersion along the horizontal direction in (b) that is marked as a blue dashed line (#4). Black arrows mark locations of band minimums. g–j ARPES data along the same cuts as in (c–f).

