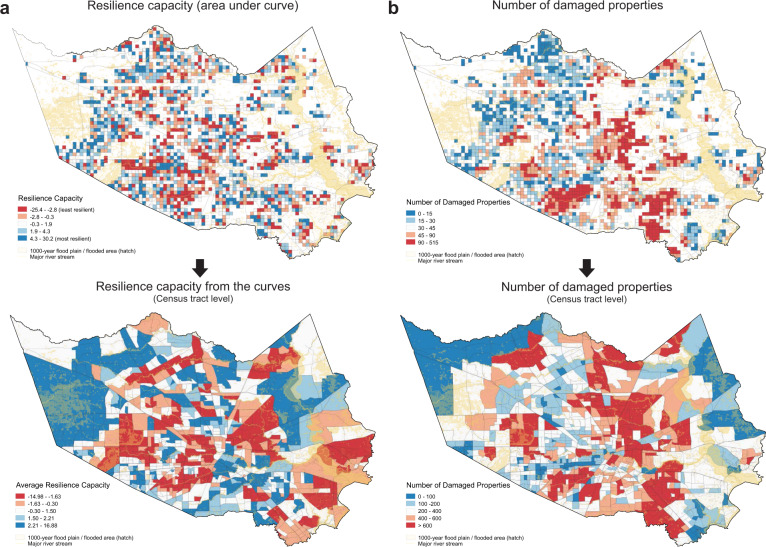
Fig. 2. Validation of neighborhood resilience measure.
a Neighborhood resilience capacity calculated as the area under the curve (AUC) represented in (a). Top is grid cell and bottom is aggregation to the census tract. Red colored neighborhoods are less resilient, while blue colored cells are more resilient. b The number of damaged properties based on the Federal Emergency Management Agency (FEMA) disaster assistance application data are illustrated at two different spatial resolutions (grid cell and census tract). Residents in red colored areas experienced more severe property damage.

