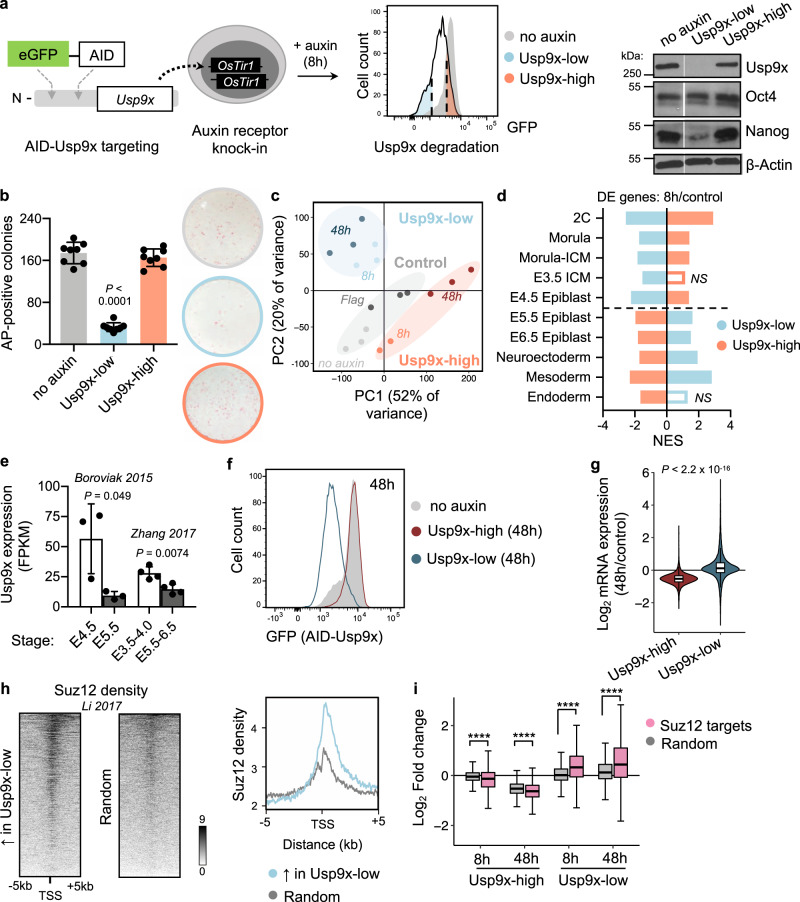
Fig. 1. Usp9x promotes ES cell self-renewal and a transcriptional signature of preimplantation linked to PRC2 activity.
a Schematic of an auxin-inducible degron (AID) system for acute Usp9x depletion in mouse embryonic stem (ES) cells with representative flow cytometry plot of GFP (AID-Usp9x) expression in Usp9x-low and Usp9x-high ES cells. Right: western blot of endogenous Usp9x level in sorted cell fractions (see Supplementary Fig. 1b). b Quantification and representative images of colony formation assays. Usp9x-low ES cells display a self-renewal deficit. AP, Alkaline Phosphatase. c Principal Component (PC) Analysis of gene expression by RNA-seq. 8h: 8 h auxin. No auxin: AID-Usp9x cells with vehicle treatment. 48h: 8 h auxin followed by 48 h recovery without auxin. Flag: Flag-Usp9x cells after 8 h auxin and 48 h recovery. d The transcriptional signatures of Usp9x-high or Usp9x-low ES cells correlate with different stages of peri-implantation development by Gene Set Enrichment Analysis (GSEA). Genes differentially expressed between Usp9x-high or Usp9x-low ES cells and controls were used in each case. See Methods for references. DE, differentially expressed (relative to controls); NS, not significant (FDR > 0.05); NES, Normalized Enrichment Score. e Usp9x mRNA expression in the epiblast declines from pre- to postimplantation36,37. f Flow cytometry plot measuring median fluorescence intensity of GFP (Usp9x expression) in Usp9x-high and Usp9x-low ES cells after 8 h auxin treatment and 48 h recovery (without auxin). g Fold-change in expression of all genes at 48 h relative to control cells, showing hypotranscription in Usp9x-high ES cells and hypertranscription in Usp9x-low ES cells. h Heatmaps with summary profile plot of Suz12 binding (data from wild-type ES cells43) over the genes upregulated in Usp9x-low cells or a random subset (N = 1310). i Boxplots showing repression (in Usp9x-high) or induction (in Usp9x-low) of Suz12 target genes57, compared to a random subset (N = 3350). Western blots represent at least two biological replicates (a). Data are mean ± s.d. of four replicates from two independent experiments (b), mean ± s.d. of 3–4 replicates (e), representative of three experiments (f, h). Boxplot hinges (g, i) show the first and third quartiles, whiskers show ±1.5*inter-quartile range (IQR) and center line shows median of three biological replicates. ****P < 2.2 × 10⁻¹⁶. P-values by one-way ANOVA with Dunnett’s multiple comparisons test to the no-auxin condition (b), two-tailed Student’s t-tests with Welch’s correction (e), two-tailed Wilcoxon rank-sum test (g), and ANOVA with pairwise two-tailed Wilcoxon tests (i).

