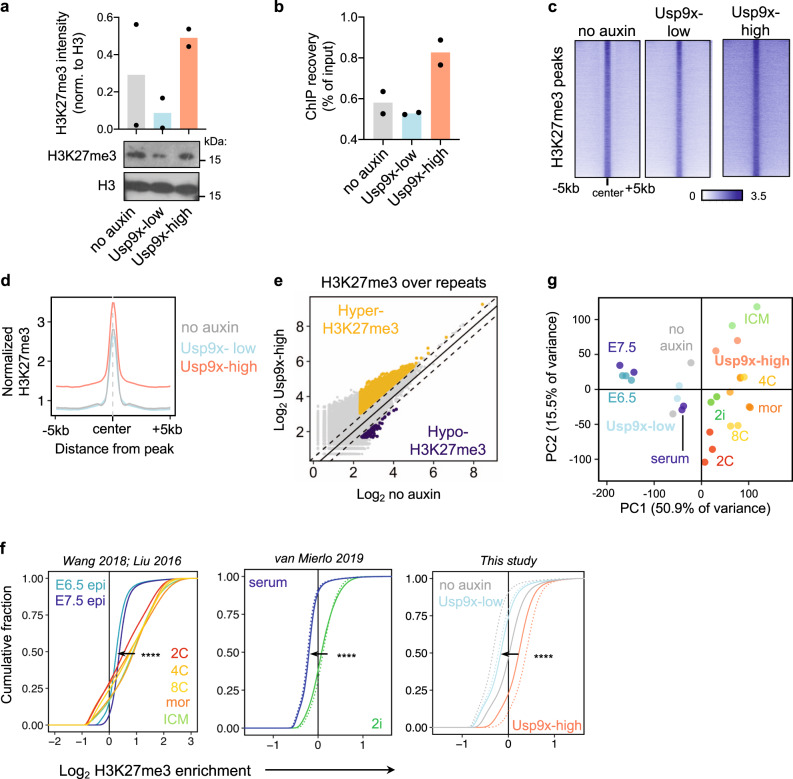
Fig. 3. Usp9x mediates a pre- to postimplantation switch in global H3K27me3 levels.
a Quantification and representative western blot of H3K27me3 from histone extracts. b ChIP recovery before sequencing recapitulates the global gain of H3K27me3 in Usp9x-high ES cells. c Heatmaps of H3K27me3 ChIP-seq signal in Usp9x-high and Usp9x-low ES cells, showing H3K27me3 spreading in Usp9x-high cells. d Profile plot depicting the mean signal of coverage shown in c. e Usp9x-high ES cells carry more H3K27me3 over repetitive elements compared to untreated (no-auxin) cells. Each point represents an individual element. Dotted lines are |log2(0.7)|. f Cumulative enrichment plots of H3K27me3 enrichment in non-overlapping genomic bins of in vivo developmental stages (left) and ES cell states (middle, right)11,59,62. Preimplantation stages (2C-ICM, top) or preimplantation-like ES cell states (2i, Usp9x-high) display H3K27me3 enrichment. Epi, epiblast; mor. morula; ICM, inner cell mass. Enrichment (x-axis) is log2(H3K27me3/input +0.5). g PCA plot clustering Usp9x-high and Usp9x-low ES cells among the samples shown in f based on genome-wide H3K27me3 distributions. Each point represents a biological replicate. Data are mean of two biological replicates (a, b), sum of two biological replicates (d, e). ****P < 2.2 × 10⁻¹⁶ by two-tailed Kolmogorov–Smirnov test comparing the average of biological replicates.

